
Advanced Engineering Mathematics
10th Edition
ISBN: 9780470458365
Author: Erwin Kreyszig
Publisher: Wiley, John & Sons, Incorporated
expand_more
expand_more
format_list_bulleted
Related questions
Question
Need help with number 10

Transcribed Image Text:Mat115
Project
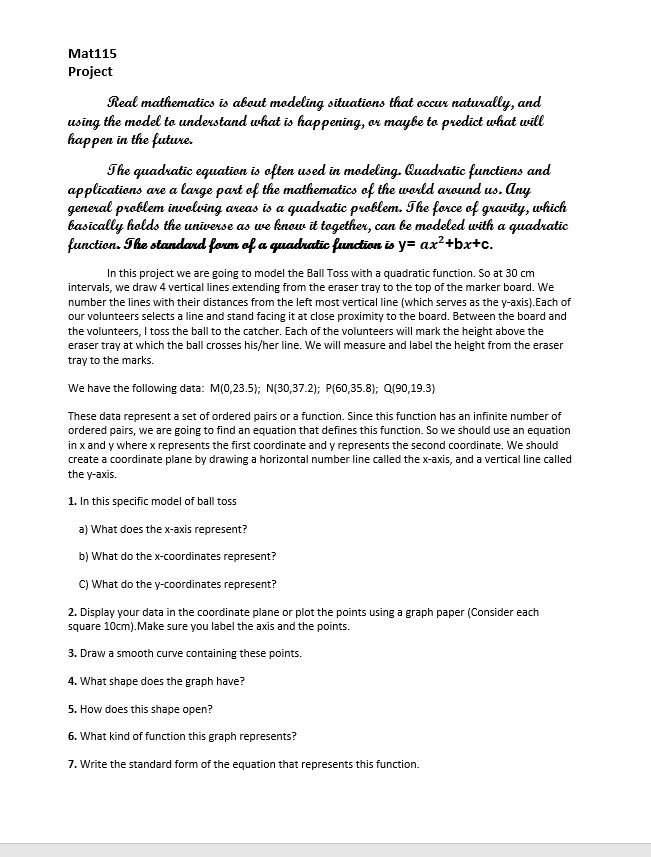
Real mathematics is about medeling situations that eccur naturally, and
using the model to understand what is happening, or maybe to predict what will
happen in the future.
The quadratic equation is often used in modeling. Quadratic functions and
applications are a large part of the mathematics of the world around us. Any
general problem involving areas is a quadratic problem. The force of gravity, which
basically holds the universe as we know it together, can be modeled with a quadratic
function. The standand form of a quadratic function is y= ax²+bx+c.
In this project we are going to model the Ball Toss with a quadratic function. So at 30 cm
intervals, we draw 4 vertical lines extending from the eraser tray to the top of the marker board. We
number the lines with their distances from the left most vertical line (which serves as the y-axis).Each of
our volunteers selects a line and stand facing it at close proximity to the board. Between the board and
the volunteers, I toss the ball to the catcher. Each of the volunteers will mark the height above the
eraser tray at which the ball crosses his/her line. We will measure and label the height from the eraser
tray to the marks.
We have the following data: M(0,23.5); N(30,37.2); P(60,35.8); Q(90,19.3)
These data represent a set of ordered pairs or a function. Since this function has an infinite number of
ordered pairs, we are going to find an equation that defines this function. So we should use an equation
in x and y where x represents the first coordinate and y represents the second coordinate. We should
create a coordinate plane by drawing a horizontal number line called the x-axis, and a vertical line called
the y-axis.
1. In this specific model of ball toss
a) What does the x-axis represent?
b) What do the x-coordinates represent?
C) What do the y-coordinates represent?
2. Display your data in the coordinate plane or plot the points using a graph paper (Consider each
square 10cm).Make sure you label the axis and the points.
3. Draw a smooth curve containing these points.
4. What shape does the graph have?
5. How does this shape open?
6. What kind of function this graph represents?
7. Write the standard form of the equation that represents this function.

Transcribed Image Text:8. Use the 3 points M (0, 23.5); N (30, 37.2) and P (60, 35.8) that verify the equation you wrote in
question #7
a) Find the quadratic polynomial that predicts y from x. (Hint: you should resolve a system of linear
equation to find the coefficients of the equation). (Round your answers to the nearest ten thousandths).
(Remember to show all your work)
b) Is the leading coefficient positive or negative?
c) Does your answer for question (8b) contradict with your answer for question (5)? (If yes, check your
work over before you continue).
9. a) What does the function say the height of the ball was when it was 120cm from the y-axis? (Round
your answer to the nearest tenth).
b) What is the sign of this height?
c) What is the position of the ball to the eraser tray?
d) Write this ordered pairs and plot its point T on the graph.
10. a) At what values of x does the function say the ball should have hit the eraser tray? (Round the
values of x to the nearest cm)
b) Display these points I and J on the graph and write their coordinates.
c) What are these points called?
11. a) At what distances from the y-axis was the ball 28 cm above the eraser tray? (Round your answers
to the nearest cm)
b) Write these ordered pairs and plot their points R and S on the graph.
12. a) At what distance from the y-axis was the ball at its highest point? (Round your answer to the
nearest cm).
b) What was the maximum height of the ball measured, of course, from the eraser tray? (Round your
answer to the nearest cm).
c) What is the name of this highest point of the graph?
d) Write the coordinate of the highest point V and plot it on the graph.
Expert Solution
This question has been solved!
Explore an expertly crafted, step-by-step solution for a thorough understanding of key concepts.

This is a popular solution

Trending nowThis is a popular solution!

Step by stepSolved in 2 steps

Knowledge Booster


Learn more about
Need a deep-dive on the concept behind this application? Look no further. Learn more about this topic, advanced-math and related others by exploring similar questions and additional content below.Similar questions
Recommended textbooks for you
- Advanced Engineering MathematicsAdvanced MathISBN:9780470458365Author:Erwin KreyszigPublisher:Wiley, John & Sons, Incorporated
 Numerical Methods for EngineersAdvanced MathISBN:9780073397924Author:Steven C. Chapra Dr., Raymond P. CanalePublisher:McGraw-Hill Education
 Introductory Mathematics for Engineering Applicat...Advanced MathISBN:9781118141809Author:Nathan KlingbeilPublisher:WILEY
  Mathematics For Machine TechnologyAdvanced MathISBN:9781337798310Author:Peterson, John.Publisher:Cengage Learning,

Advanced Engineering Mathematics
Advanced Math
ISBN:9780470458365
Author:Erwin Kreyszig
Publisher:Wiley, John & Sons, Incorporated
Numerical Methods for Engineers
Advanced Math
ISBN:9780073397924
Author:Steven C. Chapra Dr., Raymond P. Canale
Publisher:McGraw-Hill Education
Introductory Mathematics for Engineering Applicat...
Advanced Math
ISBN:9781118141809
Author:Nathan Klingbeil
Publisher:WILEY
Mathematics For Machine Technology
Advanced Math
ISBN:9781337798310
Author:Peterson, John.
Publisher:Cengage Learning,