
A First Course in Probability (10th Edition)
10th Edition
ISBN: 9780134753119
Author: Sheldon Ross
Publisher: PEARSON
expand_more
expand_more
format_list_bulleted
Related questions
Concept explainers
Question
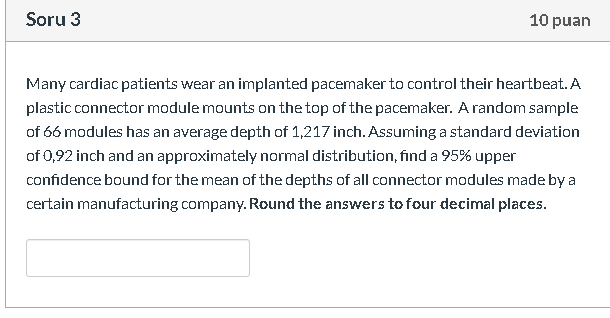

Transcribed Image Text:Many cardiac patients wear an implanted pacemaker to control their heartbeat. A
plastic connector module mounts on the top of the pacemaker. A random sample
of 66 modules has an average depth of 1,217 inch. Assuming a standard deviation
of 0,92 inch and an approximately normal distribution, find a 95% upper
confidence bound for the mean of the depths of all connector modules made by a
certain manufacturing company. Round the answers to four decimal places.
Expert Solution
This question has been solved!
Explore an expertly crafted, step-by-step solution for a thorough understanding of key concepts.

This is a popular solution

Trending nowThis is a popular solution!

Step by stepSolved in 3 steps with 3 images

Knowledge Booster


Learn more about
Need a deep-dive on the concept behind this application? Look no further. Learn more about this topic, probability and related others by exploring similar questions and additional content below.Similar questions
- Calcium levels in people are normally distributed with a mean of 9.4 and a standard deviation of 0.4 . Individuals with calcium levels in the bottom 10% dL of the population are considered to have low calcium levels. Find the calcium level that is the borderline between low calcium levels and those not considered low. Carry your intermediate computations to at least four decimal places. Round your answer to one decimal place.arrow_forwardA study of a population showed that males' body temperatures are approximately Normally distributed with a mean of 98.4°F and a population standard deviation of 0.40°F. What body temperature does a male have if he is at the 95th percentile? Draw a well-labeled sketch to support your answer.arrow_forwardA standardized exam's scores are normally distributed. In a recent year, the mean test score was 1533 and the standard deviation was 313. The test scores of four students selected at random are 1950, 1290, 2220, and 1440. Find the z-scores that correspond to each value and determine whether any of the values are unusual. The Z-score for 1950 is. (Round to two decimal places as needed.)arrow_forward
- After the pandemic hit and people were forced to spend more time indoors, there have been a suspicion among health professionals. that people are eating more and thus gaining weight. In 2018, the average weight of 192 pounds, and health experts want to know if that average weight of the American male has gone up during this pandemic. d. A sample of 50 American males yeilded a sample average weight of 195 pounds and a sample standard deviation of 14.5 pounds. What is your conclusion at the 5% level of significance? (be sure to state your conclusion in the context of this problem) e. Would your conclusion change if the level of significance were changed to 1%? Briefly explain.arrow_forwardCompute the standard deviation of the sampled proportions if p=.8 and n=50. Round to three places.arrow_forwardA standardized exam's scores are normally distributed. In a recent year, the mean test score was 1522 and the standard deviation was 311. The test scores of four students selected at random are 1950, 1260, 2190, and 1410. Find the z-scores that correspond to each value and determine whether any of the values are unusual. The z-score for 1950 is. (Round to two decimal places as needed.)arrow_forward
- Assume that adults have IQ scores that are normally distributed with a mean of 97.2 and a standard deviation 21.8. Find the first quartile Q₁, which is the IQ score separating the bottom 25% from the top 75%. (Hint: Draw a graph.) The first quartile is. (Type an integer or decimal rounded to one decimal place as needed.)arrow_forwardCalcium levels in people are normally distributed with a mean of 9.7 mgdL and a standard deviation of 0.5 mgdL . Individuals with calcium levels in the bottom 10% of the population are considered to have low calcium levels. Find the calcium level that is the borderline between low calcium levels and those not considered low. Carry your intermediate computations to at least four decimal places. Round your answer to one decimal place.arrow_forwardA standardized exam's scores are normally distributed. In a recent year, the mean test score was 1458 and the standard deviation was 312. The test scores of four students selected at random are 1860, 1220, 2150, and 1340. Find the z-scores that correspond to each value and determine whether any of the values are unusual. The z-score for 1860 is (Round to two decimal plaes as needed.)arrow_forward
arrow_back_ios
arrow_forward_ios
Recommended textbooks for you
- A First Course in Probability (10th Edition)ProbabilityISBN:9780134753119Author:Sheldon RossPublisher:PEARSON

A First Course in Probability (10th Edition)
Probability
ISBN:9780134753119
Author:Sheldon Ross
Publisher:PEARSON