
MATLAB: An Introduction with Applications
6th Edition
ISBN: 9781119256830
Author: Amos Gilat
Publisher: John Wiley & Sons Inc
expand_more
expand_more
format_list_bulleted
Related questions
Topic Video
Question
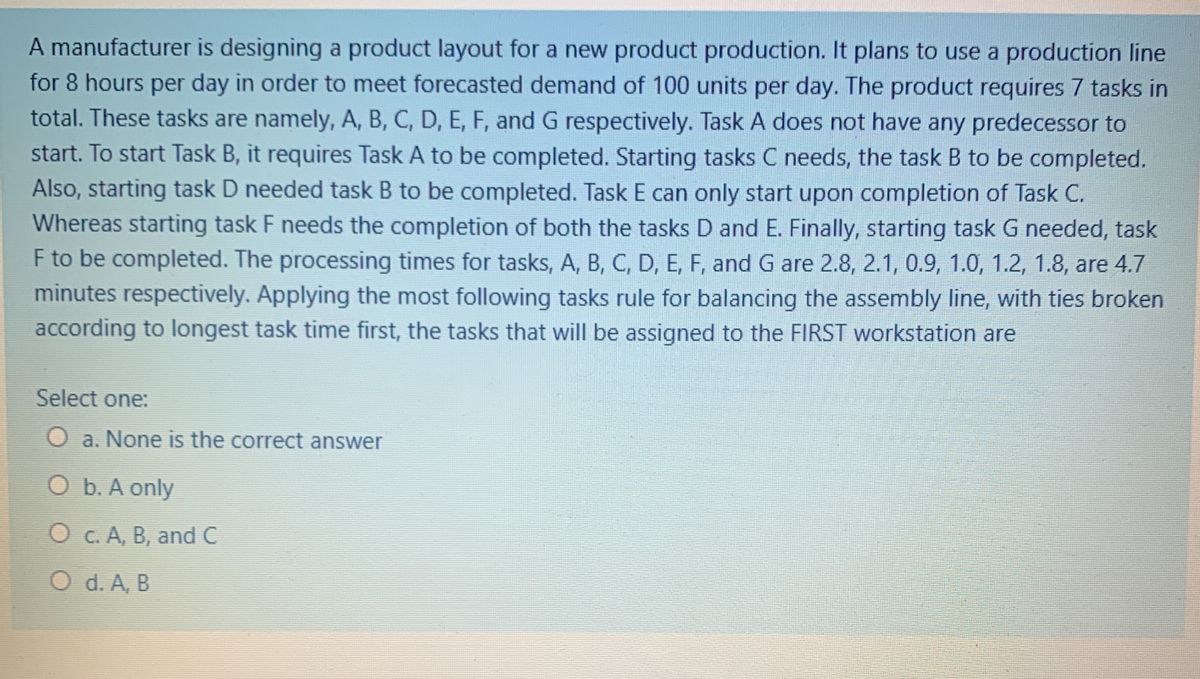

Transcribed Image Text:A manufacturer is designing a product layout for a new product production. It plans to use a production line
for 8 hours per day in order to meet forecasted demand of 100 units per day. The product requires 7 tasks in
total. These tasks are namely, A, B, C, D, E, F, and G respectively. Task A does not have any predecessor to
start. To start Task B, it requires Task A to be completed. Starting tasks C needs, the task B to be completed.
Also, starting task D needed task B to be completed. Task E can only start upon completion of Task C.
Whereas starting task F needs the completion of both the tasks D and E. Finally, starting task G needed, task
F to be completed. The processing times for tasks, A, B, C, D, E, F, and G are 2.8, 2.1, 0.9, 1.0, 1.2, 1.8, are 4.7
minutes respectively. Applying the most following tasks rule for balancing the assembly line, with ties broken
according to longest task time first, the tasks that will be assigned to the FIRST workstation are
Select one:
Oa. None is the correct answer
O b. A only
C. A, B, and C
O d. A, B

Transcribed Image Text:FACTORS FOR R CHARTS
Number of
Factor for
Observations
in Subgroup,
x Chart,
A2
Lower
Control Limit,
Upper
Control Limit,
D3
Da
1.88
3.27
1.02
2.57
0.73
0.58
2.28
4
2.11
5
0.48
2.00
0.42
0.08
1.92
0.37
0.14
1.86
8
0.34
0.18
1.82
0.31
0.22
1.78
10
0.29
0.26
1.74
11
0.27
0.28
1.72
12
0.31
1.69
0.25
13
0.24
0.33
1.67
14
0.22
0.35
1.65
15
0.36
1.64
0.21
16
0.38
1.62
17
0.20
0.39
1.61
18
0.19
0.40
1.60
19
0.19
0.41
1.59
20
0.18
23
67
Expert Solution
arrow_forward
Step 1
None is the correct answer.

Step by stepSolved in 2 steps

Knowledge Booster


Learn more about
Need a deep-dive on the concept behind this application? Look no further. Learn more about this topic, statistics and related others by exploring similar questions and additional content below.Similar questions
- Additional Algo 4-10 Integrated Work Clients are served in a process with two resources. The first resource has a capacity of 0.71 clients per hour. The capacity of the second resource is 0.5 clients per hour. The first resource has 2 workers and the second resource has 8 workers. Instruction: Round your answer to three decimal places. What is the capacity of the process if workers can now work at both resources and processing times do not change? clients per hourarrow_forwardA sprinter runs a 100meter dash at a constant rate of 8.25. Meters per second . A liner constraints models the relationship between the number of seconds since the start of the race an the distance remaining until the sprinter reaches the finish line. If the number of seconds since the distance remaining until the sprinter reaches the finish line if the number of seconds since the start of the race is independent variable which of the following solutions is viable. A.(5.5,54.625) B. (-2,116.5) C.(13,-7.25) D.(4.76)arrow_forwardInfotron Inc makes electronic hockey and soccer games. Each hockey game requires 2 labor-hours of assembly and 2 labor-hours of testing. Each soccer game requires 3 labor-hours of assembly and 1 labor-hour of testing. Each day there are 48 labor-hours available for assembly and 36 labor-hours available for testing. How many of each game should Infotron produce each day to maximize its total daily output?arrow_forward
- Suppose a furniture builder has two models of a bookcase: standard and artisan. The standard model requires 5 hours to assemble and 1 hours for finishing touches. The artisan model requires 2 hours to assemble and 4 hours for finishing touches. Based on their current staffing, they can manage a maximum number of assembly hours available is 50 per day, and the maximum number of finishing hours available is 64 per day. Let x = the number of standard model bookcases produced per day and y = the number of artisan model bookcases produced per day. Write the system of inequalities that represents the maximum number of bookcases that can be produced in one day. 0 Graph the system of inequalities, remember to include x >0 and y > 0 in your graph to get full credit. You will need to include four lines. 25 24 VIarrow_forwardProduction Line Speed and Quality Control. Brawdy Plastics, Inc., produces plastic seat belt retainers for General Motors at the Brawdy Plastics plant in Buffalo, New York. After final assembly and painting, the parts are placed on a conveyor belt that moves the parts past a final inspection station. How fast the parts move past the final inspection station depends upon the line speed of the conveyor belt (feet per minute. Although faster line speeds are desirable, management is concerned that increasing the line speed too much may not provide enough time for inspectors to identify which parts are actually defective. To test this theory, Brawdy Plastics conducted an experiment in which the same batch of parts, with a known number of defective parts, was inspected using a variety of line speeds. The following data were collected. a Develop a scatter diagram with the line speed as the independent variable. b) What does the scatter diagram developed in part (a) indicate about the…arrow_forwardG.97.arrow_forward
- *NEED HELP WITH 1, 2, and 3*DYNAMIC INVENTORY MODELSPLEASE WALK THROUGH WITH EXCEL IF POSSIBLE, PLEASE!Mohawk Industries builds transmissions for a large automobile manufacturer. One of its transmissionassemblies requires part #HD234, purchased from a supplier within the same industrial park. Because ofthe close proximity of its supplier, the lead me for part #HD234 is negligible.The demand for part #HD234 varies according to the orders received from the automobile manufacturer.The requirements schedule for the next 10 periods is shown below: Period 1 2 3 4 5 6 7 8 9 10 Total Demand 115 50 175 95 150 225 75 70 40 20 1,015 This requirements schedule is considered fairly typical. Furthermore, the cost of placing an order with anearby supplier is $85.00, the purchase cost is $65.00, and the holding cost fracon is 0.01 per period.Mohawk is in the process of assessing different lot-sizing policies. It is interested in several that havebeen suggested.Before it can decide among them,…arrow_forwardplease helparrow_forward
arrow_back_ios
arrow_forward_ios
Recommended textbooks for you
- MATLAB: An Introduction with ApplicationsStatisticsISBN:9781119256830Author:Amos GilatPublisher:John Wiley & Sons Inc
 Probability and Statistics for Engineering and th...StatisticsISBN:9781305251809Author:Jay L. DevorePublisher:Cengage Learning
 Statistics for The Behavioral Sciences (MindTap C...StatisticsISBN:9781305504912Author:Frederick J Gravetter, Larry B. WallnauPublisher:Cengage Learning
  Elementary Statistics: Picturing the World (7th E...StatisticsISBN:9780134683416Author:Ron Larson, Betsy FarberPublisher:PEARSON
 The Basic Practice of StatisticsStatisticsISBN:9781319042578Author:David S. Moore, William I. Notz, Michael A. FlignerPublisher:W. H. Freeman
 Introduction to the Practice of StatisticsStatisticsISBN:9781319013387Author:David S. Moore, George P. McCabe, Bruce A. CraigPublisher:W. H. Freeman
MATLAB: An Introduction with Applications
Statistics
ISBN:9781119256830
Author:Amos Gilat
Publisher:John Wiley & Sons Inc
Probability and Statistics for Engineering and th...
Statistics
ISBN:9781305251809
Author:Jay L. Devore
Publisher:Cengage Learning
Statistics for The Behavioral Sciences (MindTap C...
Statistics
ISBN:9781305504912
Author:Frederick J Gravetter, Larry B. Wallnau
Publisher:Cengage Learning
Elementary Statistics: Picturing the World (7th E...
Statistics
ISBN:9780134683416
Author:Ron Larson, Betsy Farber
Publisher:PEARSON
The Basic Practice of Statistics
Statistics
ISBN:9781319042578
Author:David S. Moore, William I. Notz, Michael A. Fligner
Publisher:W. H. Freeman
Introduction to the Practice of Statistics
Statistics
ISBN:9781319013387
Author:David S. Moore, George P. McCabe, Bruce A. Craig
Publisher:W. H. Freeman