
MATLAB: An Introduction with Applications
6th Edition
ISBN: 9781119256830
Author: Amos Gilat
Publisher: John Wiley & Sons Inc
expand_more
expand_more
format_list_bulleted
Related questions
Question
MAKE A GRAPH FROM THE GIVEN DATA
please do this typewritten and completely so I will upvote. Thank you and much appreciated for the help.
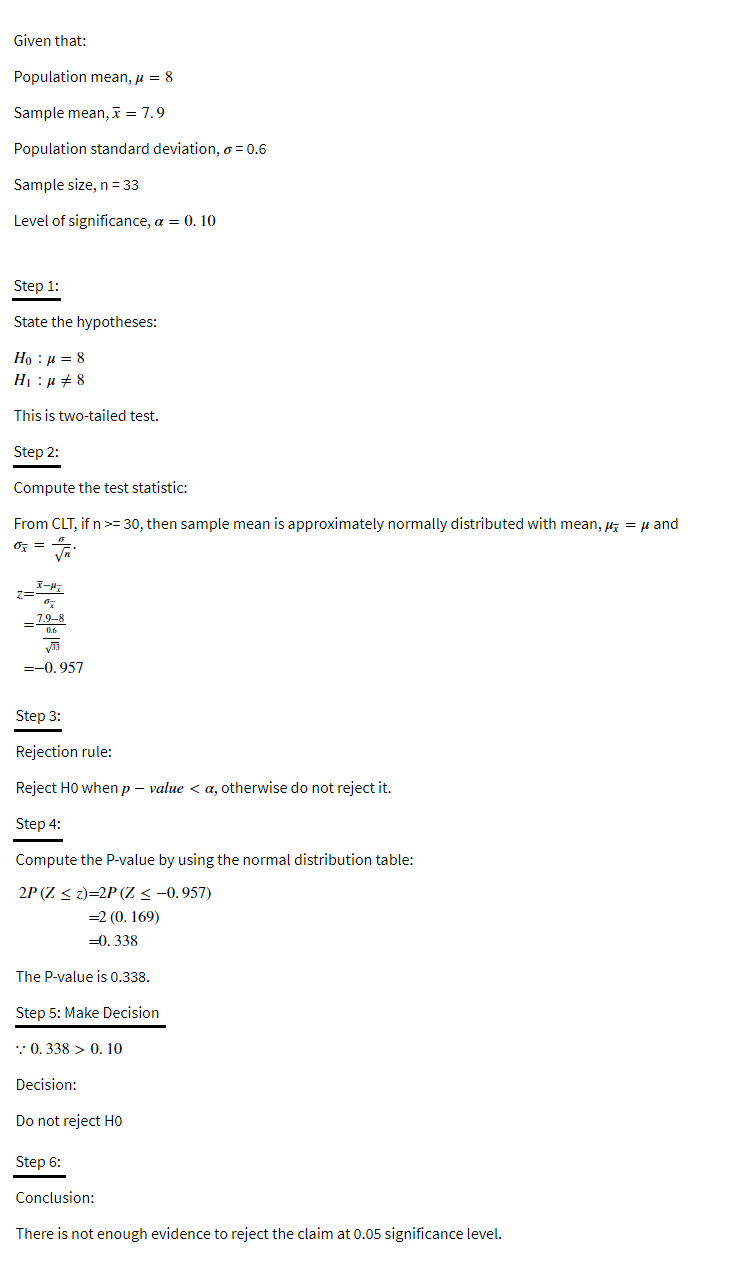

Transcribed Image Text:Given that:
Population mean, μ = 8
Sample mean, x = 7.9
Population standard deviation, o = 0.6
Sample size, n = 33
Level of significance, a = 0.10
Step 1:
State the hypotheses:
Ho : a = 8
H₁μ #8
This is two-tailed test.
Step 2:
Compute the test statistic:
From CLT, if n >= 30, then sample mean is approximately normally distributed with mean, μ = μ and
0 =
Step 3:
Rejection rule:
Reject H0 when p-value <a, otherwise do not reject it.
Step 4:
Compute the P-value by using the normal distribution table:
2P (Z ≤ z)=2P (Z ≤ -0.957)
= 2 (0.169)
=0.338
The P-value is 0.338.
Step 5: Make Decision
0.338 > 0. 10
Decision:
Do not reject HO
Step 6:
Conclusion:
There is not enough evidence to reject the claim at 0.05 significance level.
I-H₂
67
7.9-8
0.6
=
√33
= -0.957
Expert Solution
This question has been solved!
Explore an expertly crafted, step-by-step solution for a thorough understanding of key concepts.

Step by stepSolved in 2 steps with 1 images

Knowledge Booster

Similar questions
- A serving size of peanuts for a snack is 1.5 oz.The weight of the serving size can vary by no more than 0.2 oz. Graph all the weights that would be the incorrect serving size. Weight of Peanuts (oz) 1.1 1.2 1.3 1.4 1.5 1.6 1.7 1.8 1.9 2arrow_forwardGraph. 4x+y=6x-1 Show your work and explain the method used to determine the graph.arrow_forwardPlease see attachedarrow_forward
- Pry is reflected across the y-axis . Which of the following shows this transformationarrow_forwardcan you help graph this please. x > 3 Thank youarrow_forwardA line passes through the points (10,16) and (15, 24). Can the relationship be modeled by a graph of direct variation? Explain in complete sentences how you arrived at your answer. Use complete sentences.arrow_forward
arrow_back_ios
arrow_forward_ios
Recommended textbooks for you
- MATLAB: An Introduction with ApplicationsStatisticsISBN:9781119256830Author:Amos GilatPublisher:John Wiley & Sons Inc
 Probability and Statistics for Engineering and th...StatisticsISBN:9781305251809Author:Jay L. DevorePublisher:Cengage Learning
 Statistics for The Behavioral Sciences (MindTap C...StatisticsISBN:9781305504912Author:Frederick J Gravetter, Larry B. WallnauPublisher:Cengage Learning
  Elementary Statistics: Picturing the World (7th E...StatisticsISBN:9780134683416Author:Ron Larson, Betsy FarberPublisher:PEARSON
 The Basic Practice of StatisticsStatisticsISBN:9781319042578Author:David S. Moore, William I. Notz, Michael A. FlignerPublisher:W. H. Freeman
 Introduction to the Practice of StatisticsStatisticsISBN:9781319013387Author:David S. Moore, George P. McCabe, Bruce A. CraigPublisher:W. H. Freeman
MATLAB: An Introduction with Applications
Statistics
ISBN:9781119256830
Author:Amos Gilat
Publisher:John Wiley & Sons Inc
Probability and Statistics for Engineering and th...
Statistics
ISBN:9781305251809
Author:Jay L. Devore
Publisher:Cengage Learning
Statistics for The Behavioral Sciences (MindTap C...
Statistics
ISBN:9781305504912
Author:Frederick J Gravetter, Larry B. Wallnau
Publisher:Cengage Learning
Elementary Statistics: Picturing the World (7th E...
Statistics
ISBN:9780134683416
Author:Ron Larson, Betsy Farber
Publisher:PEARSON
The Basic Practice of Statistics
Statistics
ISBN:9781319042578
Author:David S. Moore, William I. Notz, Michael A. Fligner
Publisher:W. H. Freeman
Introduction to the Practice of Statistics
Statistics
ISBN:9781319013387
Author:David S. Moore, George P. McCabe, Bruce A. Craig
Publisher:W. H. Freeman