Structural Analysis
6th Edition
ISBN: 9781337630931
Author: KASSIMALI, Aslam.
Publisher: Cengage,
expand_more
expand_more
format_list_bulleted
Question

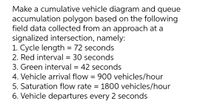
Transcribed Image Text:Make a cumulative vehicle diagram and queue
accumulation polygon based on the following
field data collected from an approach at a
signalized intersection, namely:
1. Cycle length = 72 seconds
2. Red interval = 30 seconds
3. Green interval = 42 seconds
4. Vehicle arival flow = 900 vehicles/hour
%3D
%3D
5. Saturation flow rate = 1800 vehicles/hour
6. Vehicle departures every 2 seconds
Expert Solution
This question has been solved!
Explore an expertly crafted, step-by-step solution for a thorough understanding of key concepts.
This is a popular solution
Trending nowThis is a popular solution!
Step by stepSolved in 3 steps with 3 images

Knowledge Booster
Learn more about
Need a deep-dive on the concept behind this application? Look no further. Learn more about this topic, civil-engineering and related others by exploring similar questions and additional content below.Similar questions
- At a specified point on a highway, vehicles are known to arrive according to a Poisson process. Vehicles are counted in 20-second intervals, and vehicle counts are taken in 120 of these time intervals. It is noted that no cars arrive in 18 of these 120 intervals. Approximate the number of these 120 intervals in which exactly three cars arrive. Wrong answers will be downvoted read question carefullyarrow_forwardThe time between arrivals of vehicles at a particular intersection follows an exponential probability distribution with a mean of 14 seconds. A. What is the probability that the arrival time between vehicles is 12 seconds or less (to 4 decimals)? B. What is the probability that the arrival time between vehicles is 6 seconds or less (to 4 decimals)? C. What is the probability of 30 or more seconds between vehicle arrivals (to 4 decimals)?arrow_forwardTable below shows the frequency of each speed collected from a rural highway segment. Caiculate the 85-percentile speed. Note: The 85-percentile speed is designed as the speed at or below which 85% of the traffic is travelling. Speed (MPH 25 Frequency 28 2 1 29 32 33 35 2 36 1 37 39 2 42 1 43 45 5 46 2 47 3 48 49 3 50 51 52 1 53 2 54 1 55 56 1 57 2 60 1 61 2 62 1 63 1 64 1 65 1 66 69arrow_forward
- Two observers have determined that the time headways between successive vehicles are exponentially distributed and that 70% of the headways are 8s or greater. If one of observer decides to count traffic in 40s intervals, and the other in 35s intervals, estimate the probability of each observer counting 5 or more vehicles in their own intervals?arrow_forwardAt a specified point on a highway, vehicles are known to arrive according to a Poisson process. Vehicles are counted in 20-second s are intervals, and vehicle counts are taken in 120 of these time intervals. It is noted that no cars arrive in 18 of these 120 intervals. Approximate the number of these 120 intervals in which exactly three cars arrive.arrow_forward14.6 Car 15.2 Car 19.0 Truck 15.5 Car 14.3 Car 17.4 Truck 13.7 Car The vehicles were selected by sampling whatever vehicle was entering the section, choosing every 30 seconds. Estimate the time mean speed and the space mean speed, by vehicle type, and overallarrow_forward
- Vehicles arriving at an intersection from one of the approach roads follow the Poisson distribution. The mean rate of arrival is 900 vehicles per hour. If a gap is defined as the time difference between two successive vehicle arrivals (with vehicles assumed to be points), the probability (up to four decimal places) that the gap is greater than 8 seconds isarrow_forwardthe following data were taken on five vehicles travelling consecutively 1.5km portion of the NLEX. Vehicle Time(minute) 1 1.2 2 1.0 3 1.4 4 1.3 5 1.1 Determine the density of traffic in (Veh per km) 3.33 3.83 4.33 2.83arrow_forward4. The statistical data of an urban spot speed study is given below. A set of 130 observations of spot speeds made by timing vehicles through a "Trap" of 88ft. The stopwatch was used to obtain data. The stopwatch data are grouped into 0.2 sec. Classes. The first column of the table shows the midpoint of each group. The second column of the table shows the frequency of the observations. Compute the following statistical values. a) The speed of each time class in mph (show it in the third column) b) The cumulative percent of vehicles traveling at or below indicated speed shown in the third column in mph (show it in the forth column) c) Mean or average speed (time-mean speed), median, mode, standard deviation, standard error of the mean, average time, space-mean speed, variance, 15%, and 85% speed. d) Plot the cumulative percentage, and show the statistical values of item (c) on the graph. e) Plot the frequency distribution curve and show the statistical values on the graph.arrow_forward
arrow_back_ios
arrow_forward_ios
Recommended textbooks for you

 Structural Analysis (10th Edition)Civil EngineeringISBN:9780134610672Author:Russell C. HibbelerPublisher:PEARSON
 Principles of Foundation Engineering (MindTap Cou...Civil EngineeringISBN:9781337705028Author:Braja M. Das, Nagaratnam SivakuganPublisher:Cengage Learning
 Fundamentals of Structural AnalysisCivil EngineeringISBN:9780073398006Author:Kenneth M. Leet Emeritus, Chia-Ming Uang, Joel LanningPublisher:McGraw-Hill Education
 Traffic and Highway EngineeringCivil EngineeringISBN:9781305156241Author:Garber, Nicholas J.Publisher:Cengage Learning


Structural Analysis (10th Edition)
Civil Engineering
ISBN:9780134610672
Author:Russell C. Hibbeler
Publisher:PEARSON

Principles of Foundation Engineering (MindTap Cou...
Civil Engineering
ISBN:9781337705028
Author:Braja M. Das, Nagaratnam Sivakugan
Publisher:Cengage Learning

Fundamentals of Structural Analysis
Civil Engineering
ISBN:9780073398006
Author:Kenneth M. Leet Emeritus, Chia-Ming Uang, Joel Lanning
Publisher:McGraw-Hill Education


Traffic and Highway Engineering
Civil Engineering
ISBN:9781305156241
Author:Garber, Nicholas J.
Publisher:Cengage Learning