
MATLAB: An Introduction with Applications
6th Edition
ISBN: 9781119256830
Author: Amos Gilat
Publisher: John Wiley & Sons Inc
expand_more
expand_more
format_list_bulleted
Related questions
Question
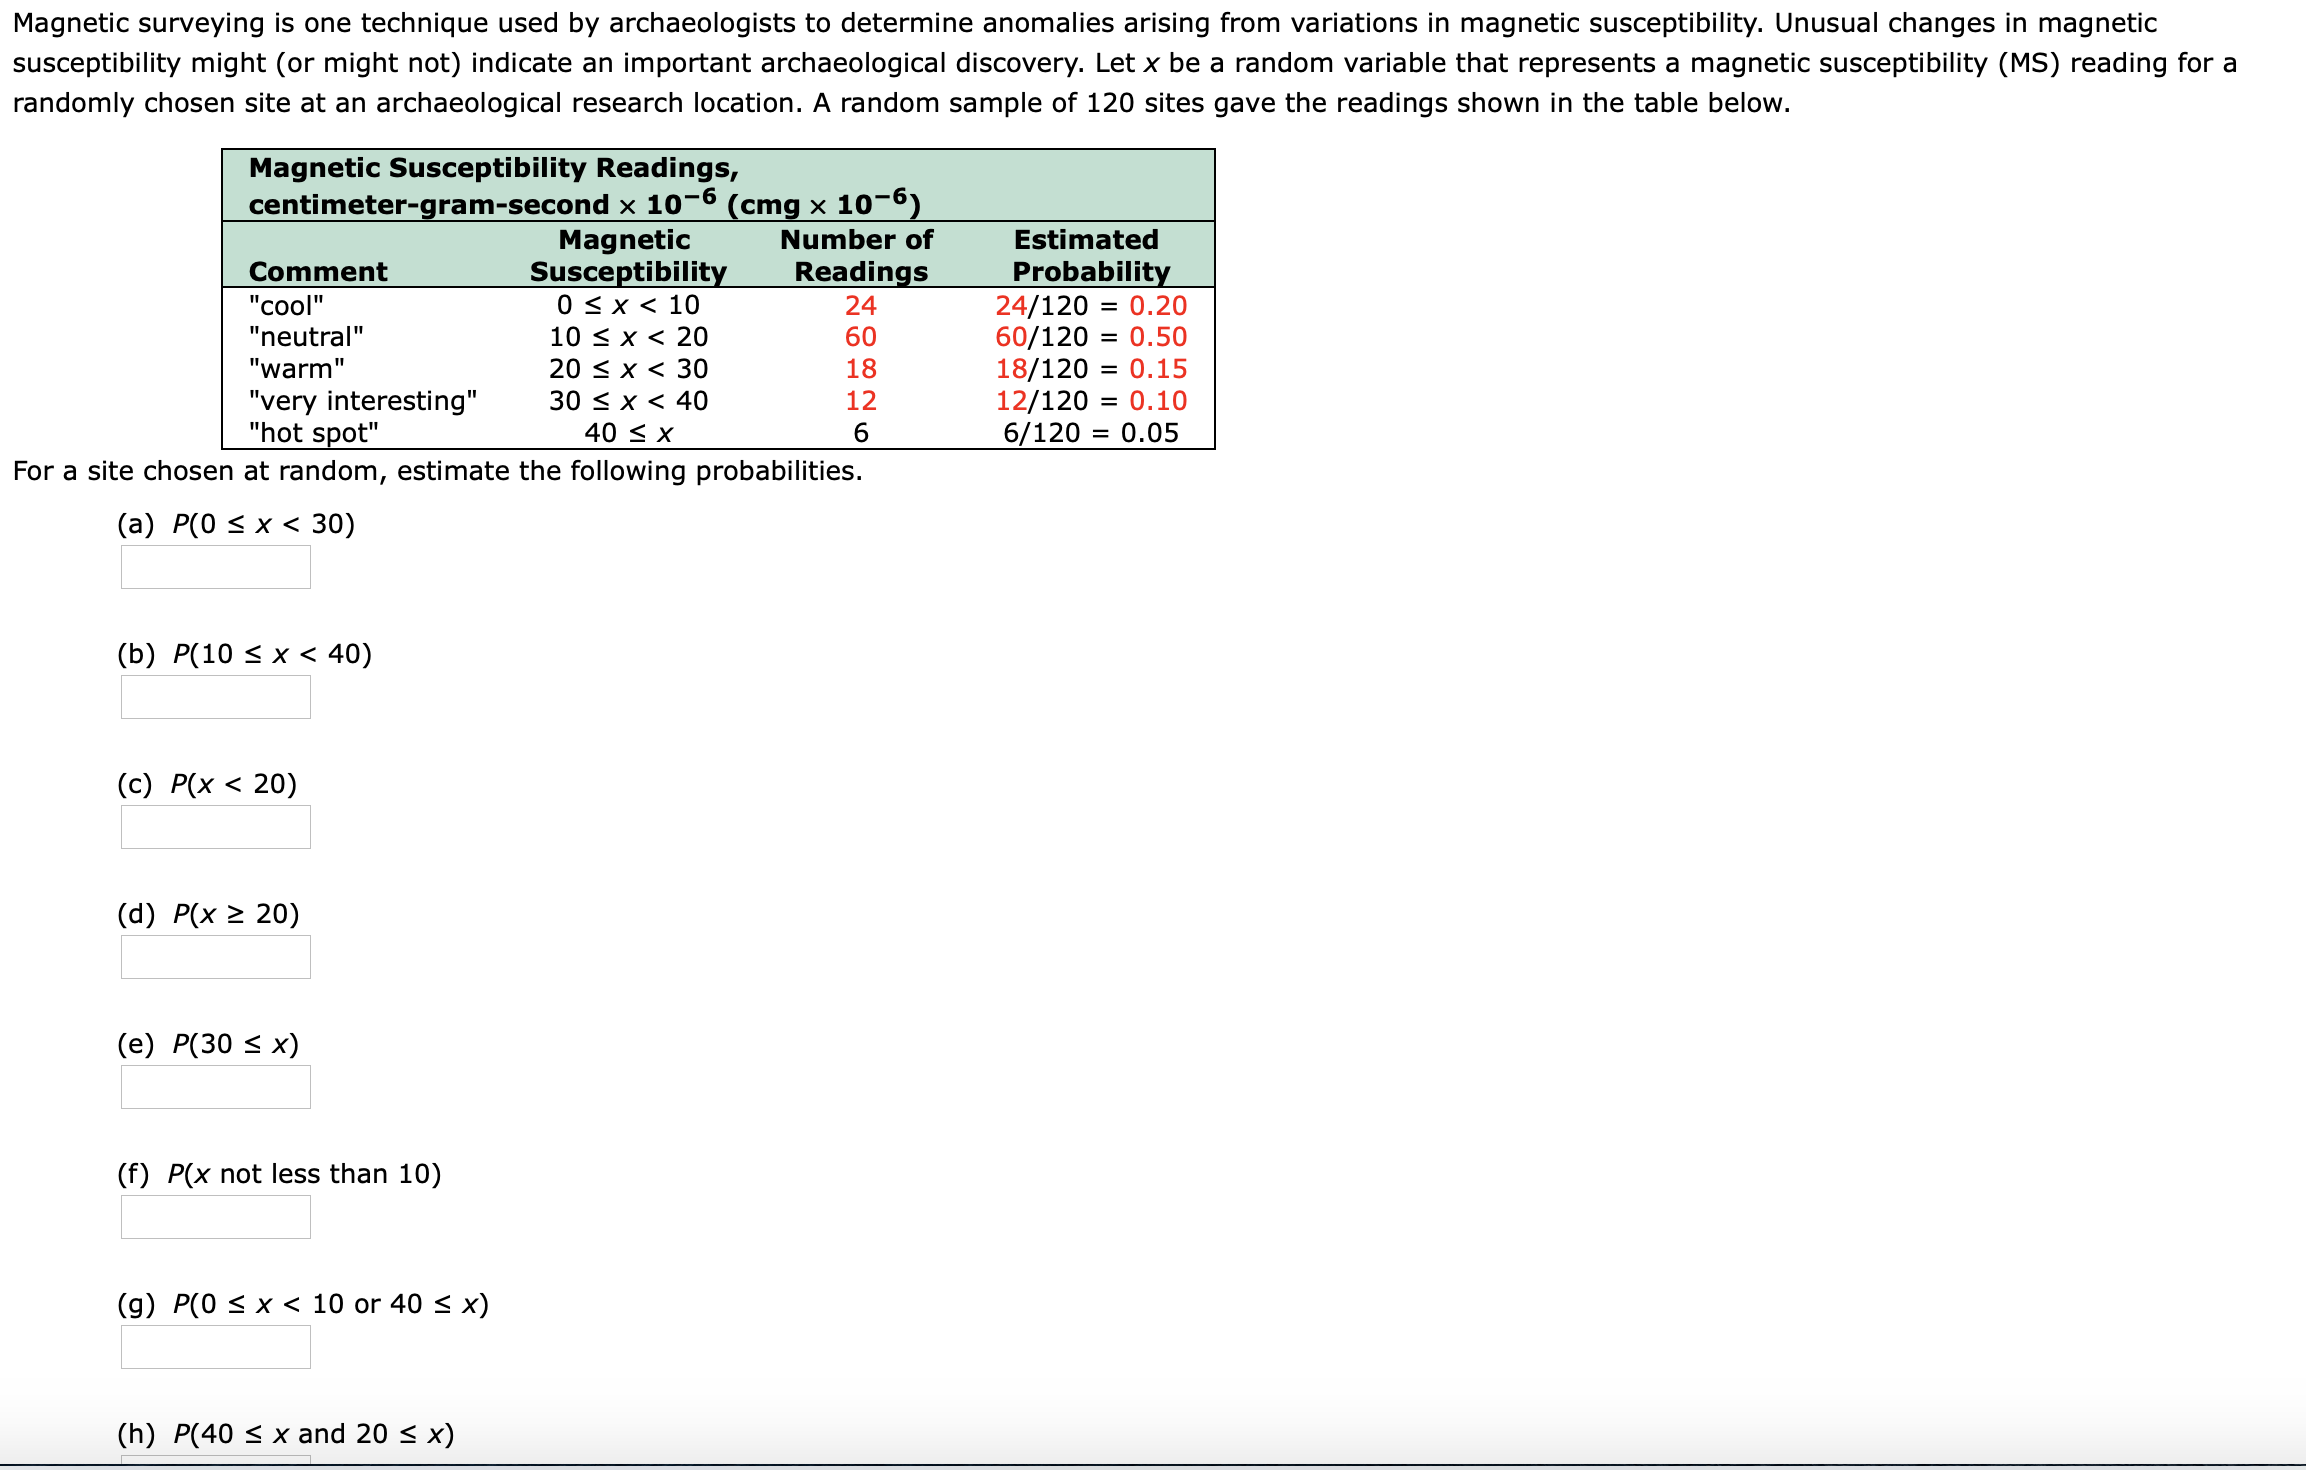

Transcribed Image Text:Magnetic surveying is one technique used by archaeologists to determine anomalies arising from variations in magnetic susceptibility. Unusual changes in magnetic
susceptibility might (or might not) indicate an important archaeological discovery. Let x be a random variable that represents a magnetic susceptibility (MS) reading for a
randomly chosen site at an archaeological research location. A random sample of 120 sites gave the readings shown in the table below.
Magnetic Susceptibility Readings,
(cmg x 10-6)
Number of
centimeter-gram-second × 10-6
Magnetic
Susceptibility
0 < x < 10
10 < x < 20
20 < x < 30
30 < x < 40
Estimated
Readings
24
Comment
Probability
24/120 = 0.20
60/120
18/120
12/120
6/120 :
"cool"
"neutral"
60
0.50
"warm"
= 0.15
= 0.10
= 0.05
18
"very interesting"
"hot spot"
12
6.
40 < x
For a site chosen at random, estimate the following probabilities.
(a) P(0 < x < 30)
(b) P(10 < x < 40)
(c) P(x < 20)
(d) P(x 2 20)
(e) P(30 < x)
(f) P(x not less than 10)
(g) P(0 < x < 10 or 40 < x)
(h) P(40 < x and 20 < x)
Expert Solution
This question has been solved!
Explore an expertly crafted, step-by-step solution for a thorough understanding of key concepts.

This is a popular solution

Trending nowThis is a popular solution!

Step by stepSolved in 2 steps with 1 images

Knowledge Booster

Similar questions
- Question 12 An analysis of variance experiment produced portions of a company ANOVA table Source of variations S.S Between groups Within groups d.f MS 25.08 Fral 3 a C. Total 117.72 79 N.B F(3,76)5% 2.724 and F3 79, 5% = 2.70 1. Specify the competing hypothesis in order to determine the population means. 2. Find the missing statistics a, b and c in the ANOVA table. 3. At the 5% significant level, what is the conclusion to the test? • Paragraph B IU A A I E E I I * x, E E E- & V G D I T 12piarrow_forwardExhibit 10-4The following information was obtained from independent random samples.Assume normally distributed populations with equal variances. Sample 1sample mean: 45sample variance: 85sample size: 10 Sample 2sample mean: 42sample variance: 90sample size: 12 Refer to Exhibit 10-4. The degrees of freedom for the t-distriubiotn arearrow_forwardQUESTION 9 The length of an adult Great White Shark is normally distributed with a mean of 3.4 meters and a standard deviation of 0.5 meters. What is the probability that a randomly selected adult Great White is more than 4.7 meters long? Click Save and Submit to save and submit. Click Save All Answers to save all answers.arrow_forward
arrow_back_ios
arrow_forward_ios
Recommended textbooks for you
- MATLAB: An Introduction with ApplicationsStatisticsISBN:9781119256830Author:Amos GilatPublisher:John Wiley & Sons Inc
 Probability and Statistics for Engineering and th...StatisticsISBN:9781305251809Author:Jay L. DevorePublisher:Cengage Learning
 Statistics for The Behavioral Sciences (MindTap C...StatisticsISBN:9781305504912Author:Frederick J Gravetter, Larry B. WallnauPublisher:Cengage Learning
  Elementary Statistics: Picturing the World (7th E...StatisticsISBN:9780134683416Author:Ron Larson, Betsy FarberPublisher:PEARSON
 The Basic Practice of StatisticsStatisticsISBN:9781319042578Author:David S. Moore, William I. Notz, Michael A. FlignerPublisher:W. H. Freeman
 Introduction to the Practice of StatisticsStatisticsISBN:9781319013387Author:David S. Moore, George P. McCabe, Bruce A. CraigPublisher:W. H. Freeman
MATLAB: An Introduction with Applications
Statistics
ISBN:9781119256830
Author:Amos Gilat
Publisher:John Wiley & Sons Inc
Probability and Statistics for Engineering and th...
Statistics
ISBN:9781305251809
Author:Jay L. Devore
Publisher:Cengage Learning
Statistics for The Behavioral Sciences (MindTap C...
Statistics
ISBN:9781305504912
Author:Frederick J Gravetter, Larry B. Wallnau
Publisher:Cengage Learning
Elementary Statistics: Picturing the World (7th E...
Statistics
ISBN:9780134683416
Author:Ron Larson, Betsy Farber
Publisher:PEARSON
The Basic Practice of Statistics
Statistics
ISBN:9781319042578
Author:David S. Moore, William I. Notz, Michael A. Fligner
Publisher:W. H. Freeman
Introduction to the Practice of Statistics
Statistics
ISBN:9781319013387
Author:David S. Moore, George P. McCabe, Bruce A. Craig
Publisher:W. H. Freeman