
MATLAB: An Introduction with Applications
6th Edition
ISBN: 9781119256830
Author: Amos Gilat
Publisher: John Wiley & Sons Inc
expand_more
expand_more
format_list_bulleted
Related questions
Question
How would I find the p value for question 24
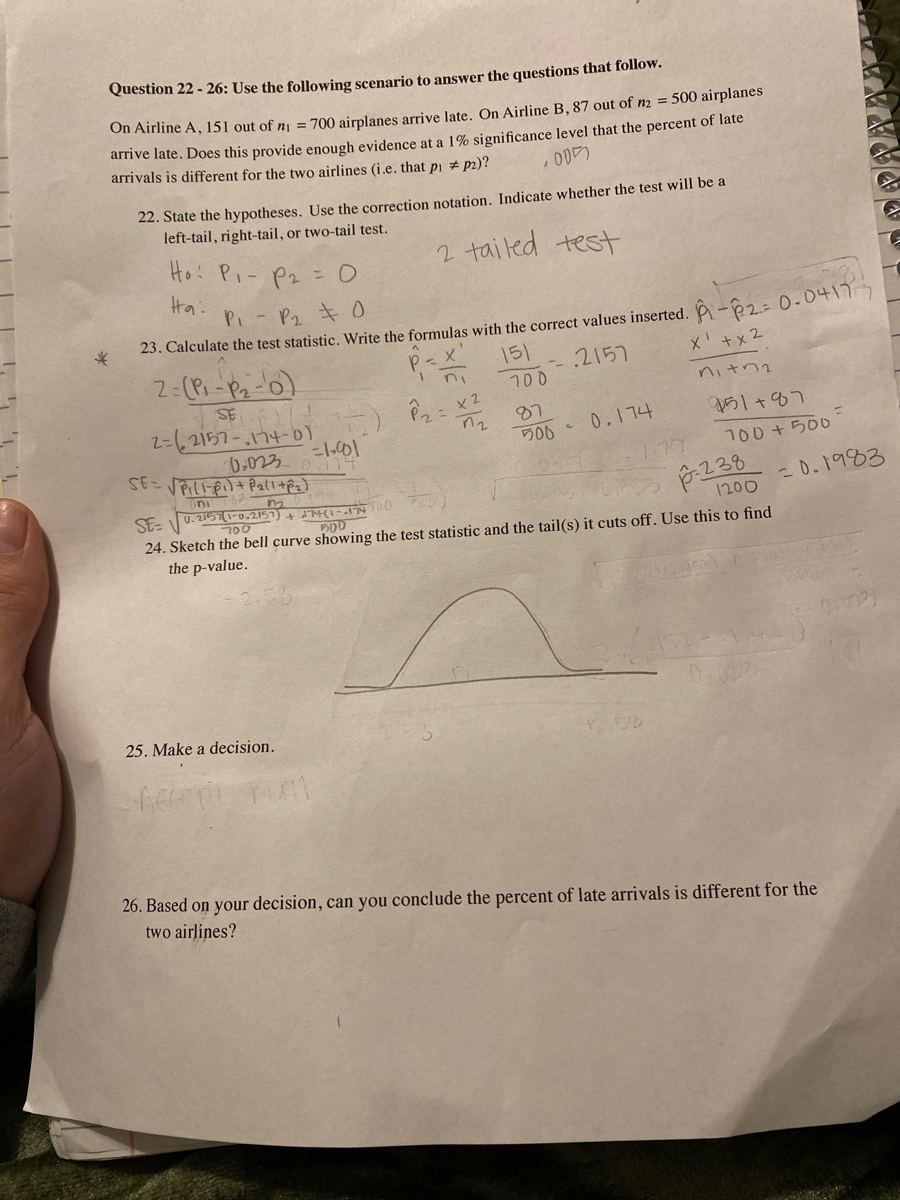

Transcribed Image Text:Question 22-26: Use the following scenario to answer the questions that follow.
On Airline A, 151 out of n₁ = 700 airplanes arrive late. On Airline B, 87 out of m2 = 500 airplanes
arrive late. Does this provide enough evidence at a 1% significance level that the percent of late
arrivals is different for the two airlines (i.e. that p₁ # P2)?
.005
22. State the hypotheses. Use the correction notation. Indicate whether the test will be a
left-tail, right-tail, or two-tail test.
2 tailed test
*
Ho: P₁ P₂ = 0
Ha:
P₁ - P₂ = 0
23. Calculate the test statistic. Write the formulas with the correct values inserted. -2= 0.0417-
151
2157
x¹ + x2
nitra
2= (P₁-P₂-¹6)
SE
2=(2157-174-01
0.023
SE=√P₁1-₁) + P₂(1+P₂)
Oni
5E₁-62-6²²—²)
=1-91
25. Make a decision.
Accepi
- X
rull
P=
ni
P₂ =
x2
700
87
500 -
0.174
-1.79
951+87
SE=
U.2157(1-0.2151) + 47+(1--174100
700
500
24. Sketch the bell curve showing the test statistic and the tail(s) it cuts off. Use this to find
the p-value.
700 +500
p-238
1200
=0.1983
142
26. Based on your decision, can you conclude the percent of late arrivals is different for the
two airlines?
Ay
Expert Solution
This question has been solved!
Explore an expertly crafted, step-by-step solution for a thorough understanding of key concepts.

Step by stepSolved in 3 steps with 1 images

Knowledge Booster

Similar questions
- scored above 640. c. There are ten teaching assistants available for grading papers in a calculus course at a large university. The first exam consists of four questions, and the professor wishes to select a different assistant to grade each question (only one assistant per question). In how many ways can the assistant be chosen for grading Question 6arrow_forwardCircle your answer to each of the following.arrow_forward
arrow_back_ios
arrow_forward_ios
Recommended textbooks for you
- MATLAB: An Introduction with ApplicationsStatisticsISBN:9781119256830Author:Amos GilatPublisher:John Wiley & Sons Inc
 Probability and Statistics for Engineering and th...StatisticsISBN:9781305251809Author:Jay L. DevorePublisher:Cengage Learning
 Statistics for The Behavioral Sciences (MindTap C...StatisticsISBN:9781305504912Author:Frederick J Gravetter, Larry B. WallnauPublisher:Cengage Learning
  Elementary Statistics: Picturing the World (7th E...StatisticsISBN:9780134683416Author:Ron Larson, Betsy FarberPublisher:PEARSON
 The Basic Practice of StatisticsStatisticsISBN:9781319042578Author:David S. Moore, William I. Notz, Michael A. FlignerPublisher:W. H. Freeman
 Introduction to the Practice of StatisticsStatisticsISBN:9781319013387Author:David S. Moore, George P. McCabe, Bruce A. CraigPublisher:W. H. Freeman
MATLAB: An Introduction with Applications
Statistics
ISBN:9781119256830
Author:Amos Gilat
Publisher:John Wiley & Sons Inc
Probability and Statistics for Engineering and th...
Statistics
ISBN:9781305251809
Author:Jay L. Devore
Publisher:Cengage Learning
Statistics for The Behavioral Sciences (MindTap C...
Statistics
ISBN:9781305504912
Author:Frederick J Gravetter, Larry B. Wallnau
Publisher:Cengage Learning
Elementary Statistics: Picturing the World (7th E...
Statistics
ISBN:9780134683416
Author:Ron Larson, Betsy Farber
Publisher:PEARSON
The Basic Practice of Statistics
Statistics
ISBN:9781319042578
Author:David S. Moore, William I. Notz, Michael A. Fligner
Publisher:W. H. Freeman
Introduction to the Practice of Statistics
Statistics
ISBN:9781319013387
Author:David S. Moore, George P. McCabe, Bruce A. Craig
Publisher:W. H. Freeman