ENGR.ECONOMIC ANALYSIS
14th Edition
ISBN: 9780190931919
Author: NEWNAN
Publisher: Oxford University Press
expand_more
expand_more
format_list_bulleted
Question
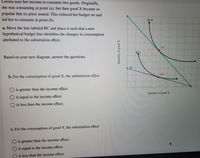
Please see below. I need help with this. Please use the picture to move the part on the graph.

Transcribed Image Text:Lorena uses her income to consume two goods. Originally,
she was consuming at point (a), but then good X became so
popular that its price soared. This reduced her budget set and
led her to consume at point (b).
IC O
a. Move the line labeled BC and place it such that a new
hypothetical budget line identifies the changes in consumption
attributed to the substitution effect.
(а)
IÇ 1
Based on your new diagram, answer the questions.
BC
(b)
b. For the consumption of good X, the substitution effect
is greater than the income effect.
Quantity of good Y
is equal to the income effect.
O is less than the income effect.
c. For the consumption of good Y, the substitution effect
O is greater than the income effect.
is equal to the income effect.
is less than the income effect.
Quantity of good X
Expert Solution
arrow_forward
Step 1
- The budget line is a graphical representation of all possible combinations of the two commodities that can be purchased with given income and cost, so that the price of each the total of these combinations equals the customer's monetary earnings.
- An indifference curve in economics connects points on a graph representing different quantities of two goods, points between which a consumer is agnostic.
Trending nowThis is a popular solution!
Step by stepSolved in 2 steps with 1 images

Knowledge Booster
Learn more about
Need a deep-dive on the concept behind this application? Look no further. Learn more about this topic, economics and related others by exploring similar questions and additional content below.Similar questions
- Fill in the table below, giving a numerical value for letters A, B, C, and D. TC AFC AVC 50 1 90 A B D 30 2.arrow_forward8 Write an email (120-150 words) to ask for • information about an activity that you would like to do. Use an idea from the list or your own idea. Follow the content checklist and remember to use indirect questions. a course at a college or with a one-to-one tutor a sport / activity at a gym joining a volunteering group Checklist • how you heard about the course / activity/group ⚫ the days and times ⚫ the cost if you need any experience / skills • if you need any equipmentarrow_forwardhttps://www.youtube.com/watch?v=4rUfoU04QJM please I need a short summary of this videoarrow_forward
arrow_back_ios
arrow_forward_ios
Recommended textbooks for you

 Principles of Economics (12th Edition)EconomicsISBN:9780134078779Author:Karl E. Case, Ray C. Fair, Sharon E. OsterPublisher:PEARSON
 Engineering Economy (17th Edition)EconomicsISBN:9780134870069Author:William G. Sullivan, Elin M. Wicks, C. Patrick KoellingPublisher:PEARSON
 Principles of Economics (MindTap Course List)EconomicsISBN:9781305585126Author:N. Gregory MankiwPublisher:Cengage Learning
 Managerial Economics: A Problem Solving ApproachEconomicsISBN:9781337106665Author:Luke M. Froeb, Brian T. McCann, Michael R. Ward, Mike ShorPublisher:Cengage Learning
 Managerial Economics & Business Strategy (Mcgraw-...EconomicsISBN:9781259290619Author:Michael Baye, Jeff PrincePublisher:McGraw-Hill Education


Principles of Economics (12th Edition)
Economics
ISBN:9780134078779
Author:Karl E. Case, Ray C. Fair, Sharon E. Oster
Publisher:PEARSON

Engineering Economy (17th Edition)
Economics
ISBN:9780134870069
Author:William G. Sullivan, Elin M. Wicks, C. Patrick Koelling
Publisher:PEARSON

Principles of Economics (MindTap Course List)
Economics
ISBN:9781305585126
Author:N. Gregory Mankiw
Publisher:Cengage Learning

Managerial Economics: A Problem Solving Approach
Economics
ISBN:9781337106665
Author:Luke M. Froeb, Brian T. McCann, Michael R. Ward, Mike Shor
Publisher:Cengage Learning

Managerial Economics & Business Strategy (Mcgraw-...
Economics
ISBN:9781259290619
Author:Michael Baye, Jeff Prince
Publisher:McGraw-Hill Education