
MATLAB: An Introduction with Applications
6th Edition
ISBN: 9781119256830
Author: Amos Gilat
Publisher: John Wiley & Sons Inc
expand_more
expand_more
format_list_bulleted
Related questions
Question
Looking at the data,
Complete a cross tab and find the relationship between Gender and Proud.
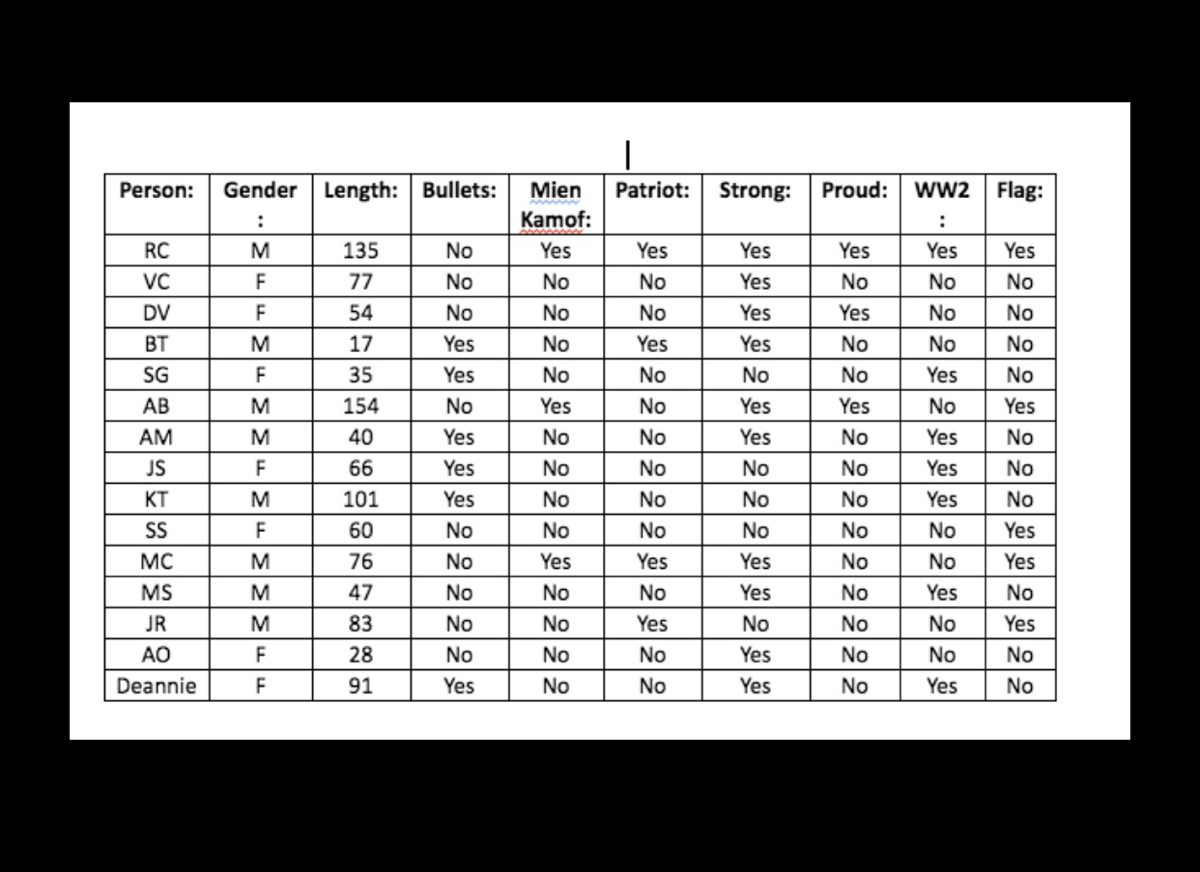

Transcribed Image Text:Person:
Gender
Length: Bullets:
Mien
Patriot:
Strong:
Proud: ww2 Flag:
Kamof:
RC
M
135
No
Yes
Yes
Yes
Yes
Yes
Yes
VC
F
77
No
No
No
Yes
No
No
No
DV
F
54
No
No
No
Yes
Yes
No
No
BT
M
17
Yes
No
Yes
Yes
No
No
No
SG
F
35
Yes
No
No
No
No
Yes
No
AB
M
154
No
Yes
No
Yes
Yes
No
Yes
AM
M
40
Yes
No
No
Yes
No
Yes
No
JS
F
66
Yes
No
No
No
No
Yes
No
KT
M
101
Yes
No
No
No
No
Yes
No
S
F
60
No
No
No
No
No
No
Yes
MC
M
76
No
Yes
Yes
Yes
No
No
Yes
MS
M
47
No
No
No
Yes
No
Yes
No
JR
M
83
No
No
Yes
No
No
No
Yes
AO
28
No
No
No
Yes
No
No
No
Deannie
91
Yes
No
No
Yes
No
Yes
No
22 2 22 2222 2 2
Expert Solution
This question has been solved!
Explore an expertly crafted, step-by-step solution for a thorough understanding of key concepts.

Step by stepSolved in 3 steps with 2 images

Knowledge Booster

Similar questions
- Student grades on a chemistry exam were: 77, 78, 76, 81, 86, 51, 79, 82, 84, 99Construct a stem-and-leaf plot of the data.arrow_forwardThe final letter grades earned on a mathematies course are given in the table below. A B C D F W 12 20 10 4 Use a pie chart to represent this data. Write down the work leading to your answer. The last page has a protractor which you may print and use.arrow_forwardA researcher collected information about the height of different flowers. What type of data is heightarrow_forward
- The Acme Company manufactures widgets. The distribution of widget weights is bell-shaped. The widget weights have a mean of 40 ounces and a standard deviation of 10 ounces. Use the Standard Deviation Rule, also known as the Empirical Rule. Suggestion: sketch the distribution in order to answer these questions. a) 99.7% of the widget weights lie between and b) What percentage of the widget weights lie between 20 and 70 ounces? c) What percentage of the widget weights lie above 30 ? Question Help: Video Message instructor %arrow_forwardA pediatrician wants to determine the relation that may exist between a child's height and head circumference. She randomly selects 5 children and measures their height and head circumference. The data are summarized below. Complete parts (a) through (f) below. Height (inches), x Head Circumference (inches), y 27.75 27.5 25.5 26 270 17.6 17.5 17.1 17.3 17.5 (a) Treating height as the explanatory variable, x, use technology to determine the estimates of B and B4 Po z bo = (Round to four decimal places as needed.) B, xb, = (Round to four decimal places as needed.)arrow_forwardFind the original data from the stem-and-leaf plot. Stem leaves 76 358 77 348 78 18arrow_forward
- General Social Survey (GSS) 2006 collected the data of the number of people in each household in the U.S. The variable name is "hompop."arrow_forwardHillary and Devin will collect data to find out where the seventh-grade students should take their field trip. Which group should Hillary and Devin survey to collect the best data?arrow_forwardPlease solve with the full step and no reject thank uarrow_forward
- Find the 5 number summary for the data shown. 2 3 9. 26 43 46 68 72 86 87| 92 95 number summary: N 5arrow_forwardHow will I draw the bar chart using the data provided in the picture by using R code? The X-axis will be the month labels The Y-axis will be the immigrant data. Thanks.arrow_forwardDetermine whether the data is from a primary or secondary source. Primary Secondaryarrow_forward
arrow_back_ios
SEE MORE QUESTIONS
arrow_forward_ios
Recommended textbooks for you
- MATLAB: An Introduction with ApplicationsStatisticsISBN:9781119256830Author:Amos GilatPublisher:John Wiley & Sons Inc
 Probability and Statistics for Engineering and th...StatisticsISBN:9781305251809Author:Jay L. DevorePublisher:Cengage Learning
 Statistics for The Behavioral Sciences (MindTap C...StatisticsISBN:9781305504912Author:Frederick J Gravetter, Larry B. WallnauPublisher:Cengage Learning
  Elementary Statistics: Picturing the World (7th E...StatisticsISBN:9780134683416Author:Ron Larson, Betsy FarberPublisher:PEARSON
 The Basic Practice of StatisticsStatisticsISBN:9781319042578Author:David S. Moore, William I. Notz, Michael A. FlignerPublisher:W. H. Freeman
 Introduction to the Practice of StatisticsStatisticsISBN:9781319013387Author:David S. Moore, George P. McCabe, Bruce A. CraigPublisher:W. H. Freeman
MATLAB: An Introduction with Applications
Statistics
ISBN:9781119256830
Author:Amos Gilat
Publisher:John Wiley & Sons Inc
Probability and Statistics for Engineering and th...
Statistics
ISBN:9781305251809
Author:Jay L. Devore
Publisher:Cengage Learning
Statistics for The Behavioral Sciences (MindTap C...
Statistics
ISBN:9781305504912
Author:Frederick J Gravetter, Larry B. Wallnau
Publisher:Cengage Learning
Elementary Statistics: Picturing the World (7th E...
Statistics
ISBN:9780134683416
Author:Ron Larson, Betsy Farber
Publisher:PEARSON
The Basic Practice of Statistics
Statistics
ISBN:9781319042578
Author:David S. Moore, William I. Notz, Michael A. Fligner
Publisher:W. H. Freeman
Introduction to the Practice of Statistics
Statistics
ISBN:9781319013387
Author:David S. Moore, George P. McCabe, Bruce A. Craig
Publisher:W. H. Freeman