
MATLAB: An Introduction with Applications
6th Edition
ISBN: 9781119256830
Author: Amos Gilat
Publisher: John Wiley & Sons Inc
expand_more
expand_more
format_list_bulleted
Related questions
Concept explainers
Question
thumb_up100%
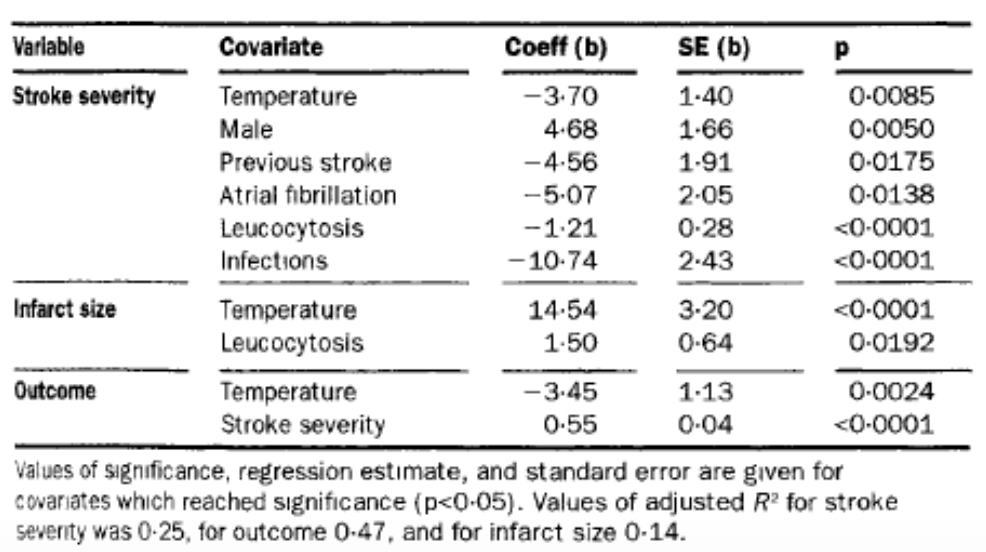
Look at the Table, specifically the information related to "stroke severity." What is the dependent and the independent variables? Provide an interpretation of the coefficient (coeff), standard error (SE), and p-value for temperature & previous stroke.

Transcribed Image Text:Varlable
Covariate
Coeff (b)
SE (b)
Stroke severity
Temperature
Male
0-0085
0-0050
-3.70
1-40
4-68
1-66
Previous stroke
-4-56
1-91
0-0175
Atrial fibrillation
-5-07
2-05
0-0138
-1-21
<0-0001
Leucocytosis
Infections
0-28
-10-74
2-43
<0-0001
Infarct size
3-20
Temperature
Leucocytosis
14-54
<0-0001
1-50
0-64
0-0192
Outcome
-3.45
0-0024
Temperature
Stroke severity
1-13
0-55
0-04
<0-0001
Values of significance, regression estimate, and standard error are given for
Covariates which reached significance (p<0-05). Values of adjusted R for stroke
severnty was 0-25, for outcome 0-47, and for infarct size 0-14.
Expert Solution
arrow_forward
Step 1
The dependent variable is a variable that changes depending on the value of another variable.
The independent variables are the variables that are manipulated by researcher to study its effect on the dependent variable.
For the first part of table, stroke severity is a dependent variable that depends on many other variables as temperature, male, previous stroke atrial fibrillation, leucocytosis and infections, thus all these variables are independent variables.

Step by stepSolved in 4 steps

Knowledge Booster


Learn more about
Need a deep-dive on the concept behind this application? Look no further. Learn more about this topic, statistics and related others by exploring similar questions and additional content below.Similar questions
- What is the most significant independent variable? Smoker Age Blood Pressurearrow_forwardPlease discuss the concepts of Mean, Median, Mode, and Standard Deviation, including when each should be used, and evaluate the differences of each. How can knowing this information about data help us?arrow_forwardPlease show work in Excel.arrow_forward
arrow_back_ios
arrow_forward_ios
Recommended textbooks for you
- MATLAB: An Introduction with ApplicationsStatisticsISBN:9781119256830Author:Amos GilatPublisher:John Wiley & Sons Inc
 Probability and Statistics for Engineering and th...StatisticsISBN:9781305251809Author:Jay L. DevorePublisher:Cengage Learning
 Statistics for The Behavioral Sciences (MindTap C...StatisticsISBN:9781305504912Author:Frederick J Gravetter, Larry B. WallnauPublisher:Cengage Learning
  Elementary Statistics: Picturing the World (7th E...StatisticsISBN:9780134683416Author:Ron Larson, Betsy FarberPublisher:PEARSON
 The Basic Practice of StatisticsStatisticsISBN:9781319042578Author:David S. Moore, William I. Notz, Michael A. FlignerPublisher:W. H. Freeman
 Introduction to the Practice of StatisticsStatisticsISBN:9781319013387Author:David S. Moore, George P. McCabe, Bruce A. CraigPublisher:W. H. Freeman
MATLAB: An Introduction with Applications
Statistics
ISBN:9781119256830
Author:Amos Gilat
Publisher:John Wiley & Sons Inc
Probability and Statistics for Engineering and th...
Statistics
ISBN:9781305251809
Author:Jay L. Devore
Publisher:Cengage Learning
Statistics for The Behavioral Sciences (MindTap C...
Statistics
ISBN:9781305504912
Author:Frederick J Gravetter, Larry B. Wallnau
Publisher:Cengage Learning
Elementary Statistics: Picturing the World (7th E...
Statistics
ISBN:9780134683416
Author:Ron Larson, Betsy Farber
Publisher:PEARSON
The Basic Practice of Statistics
Statistics
ISBN:9781319042578
Author:David S. Moore, William I. Notz, Michael A. Fligner
Publisher:W. H. Freeman
Introduction to the Practice of Statistics
Statistics
ISBN:9781319013387
Author:David S. Moore, George P. McCabe, Bruce A. Craig
Publisher:W. H. Freeman