
Database System Concepts
7th Edition
ISBN: 9780078022159
Author: Abraham Silberschatz Professor, Henry F. Korth, S. Sudarshan
Publisher: McGraw-Hill Education
expand_more
expand_more
format_list_bulleted
Related questions
Question
Shows the results of applying gamma correction to an input image using two different values of n, how does the shape of the curve change if we were to use a different value for n?
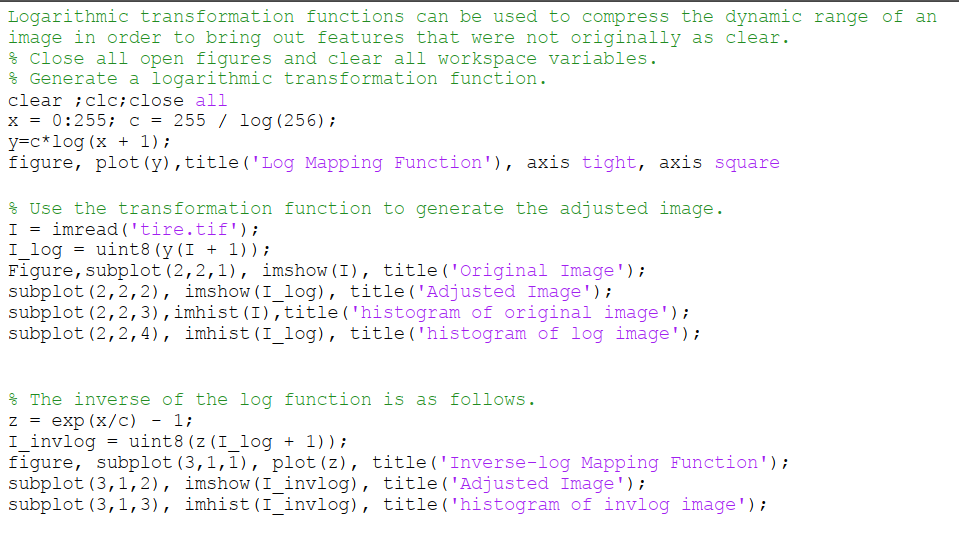

Transcribed Image Text:Logarithmic transformation functions can be used to compress the dynamic range of an
image in order to bring out features that were not originally as clear.
* Close all open figures and clear all workspace variables.
% Generate a logarithmic transformation function.
clear ;clc;close all
x = 0:255; c = 255 / log (256) ;
y=c*log (x + 1);
figure, plot (y),title('Log Mapping Function'), axis tight, axis square
% Use the transformation function to generate the adjusted image.
imread ('tire.tif');
= I
I_log = uint8 (y(I + 1)) ;
Figure, subplot (2,2,1), imshow (I), title('Original Image');
subplot (2,2, 2), imshow(I_log), title('Adjusted Image');
subplot (2,2,3),imhist(I),title('histogram of original image');
subplot (2,2,4), imhist(I_log), title ('histogram of log image');
% The inverse of the log function is as follows.
exp (x/c) - 1;
I_invlog
figure, subplot (3,1,1), plot (z), title ('Inverse-log Mapping Function');
subplot (3,1,2), imshow (I_invlog), title('Adjusted Image');
subplot (3,1,3), imhist(I_invlog), title ('histogram of invlog image');
= uint8 (z (I_log + 1)) ;
![% Create a negative transformation function and show the result after applied to the
moon image.
imread('moon.tif');
= uint8(255:-1:0);
y
I_neg
y (I + 1);
figure, subplot(1,3,1), plot(y),title('Transformation Function'),
xlim ( [0 255]), ylim([0 255]);
subplot (1,3,2), imshow (I), title ('Original Image');
subplot (1,3,3), imshow (I_neg), title('Negative Image');
I_cmp
imcomplement (I); figure, imshow(I_cmp)](https://content.bartleby.com/qna-images/question/a399817f-fafa-4575-9d3c-7151d439e0d0/ece5db4c-a3c1-40f6-b19a-f4f2f60e45f9/4ta4acq_processed.png)
Transcribed Image Text:% Create a negative transformation function and show the result after applied to the
moon image.
imread('moon.tif');
= uint8(255:-1:0);
y
I_neg
y (I + 1);
figure, subplot(1,3,1), plot(y),title('Transformation Function'),
xlim ( [0 255]), ylim([0 255]);
subplot (1,3,2), imshow (I), title ('Original Image');
subplot (1,3,3), imshow (I_neg), title('Negative Image');
I_cmp
imcomplement (I); figure, imshow(I_cmp)
Expert Solution
This question has been solved!
Explore an expertly crafted, step-by-step solution for a thorough understanding of key concepts.

This is a popular solution

Trending nowThis is a popular solution!

Step by stepSolved in 2 steps with 6 images

Knowledge Booster


Learn more about
Need a deep-dive on the concept behind this application? Look no further. Learn more about this topic, computer-science and related others by exploring similar questions and additional content below.Similar questions
- Using Matlab Using any picture plot two images modifications of your choice as follow: Image modification of Image modification of your choice (different from above) label it your choice (different from above) label itarrow_forwardThe pixels in a 3 x 3 image sub-block are as follows: 3 4 2 9 ? 1 3 7 3 (a) Estimate the unknown pixel in the center using both a mean and a median estimator. (b) Repeat if the pixel of value 1 is changed to 25. Are both the mean and median affected? Why or why not?arrow_forwardPlease help me answer question 1.34 in the attached image. I believe we are to draw the signal. Thank you.arrow_forward
- Compute the output image after applying the input image with the given sharpening filter in producing the smoothing operation (assume intensity Level resolution = 8 bits/px) Input image, f(x.y) 10 10 10 10 10 10 Sharpening filter, w(x.y) 10 10 11 12 100 10 -1 -1 -1 10 12 14 101 102 10 -1 9 -1 10 15 111 110 | 100 | 10 -1 -1 -1 10 10 10 10 | 10 10 ANSWER : Output image, g(x.y) 0|000 0 0 000 0 0arrow_forwardDoes orthographic projection require simpler mathematics compared to classical viewing in computer graphics and visulization?arrow_forward
arrow_back_ios
arrow_forward_ios
Recommended textbooks for you
- Database System ConceptsComputer ScienceISBN:9780078022159Author:Abraham Silberschatz Professor, Henry F. Korth, S. SudarshanPublisher:McGraw-Hill Education
 Starting Out with Python (4th Edition)Computer ScienceISBN:9780134444321Author:Tony GaddisPublisher:PEARSON
 Digital Fundamentals (11th Edition)Computer ScienceISBN:9780132737968Author:Thomas L. FloydPublisher:PEARSON
  C How to Program (8th Edition)Computer ScienceISBN:9780133976892Author:Paul J. Deitel, Harvey DeitelPublisher:PEARSON
 Database Systems: Design, Implementation, & Manag...Computer ScienceISBN:9781337627900Author:Carlos Coronel, Steven MorrisPublisher:Cengage Learning
 Programmable Logic ControllersComputer ScienceISBN:9780073373843Author:Frank D. PetruzellaPublisher:McGraw-Hill Education
Database System Concepts
Computer Science
ISBN:9780078022159
Author:Abraham Silberschatz Professor, Henry F. Korth, S. Sudarshan
Publisher:McGraw-Hill Education
Starting Out with Python (4th Edition)
Computer Science
ISBN:9780134444321
Author:Tony Gaddis
Publisher:PEARSON
Digital Fundamentals (11th Edition)
Computer Science
ISBN:9780132737968
Author:Thomas L. Floyd
Publisher:PEARSON
C How to Program (8th Edition)
Computer Science
ISBN:9780133976892
Author:Paul J. Deitel, Harvey Deitel
Publisher:PEARSON
Database Systems: Design, Implementation, & Manag...
Computer Science
ISBN:9781337627900
Author:Carlos Coronel, Steven Morris
Publisher:Cengage Learning
Programmable Logic Controllers
Computer Science
ISBN:9780073373843
Author:Frank D. Petruzella
Publisher:McGraw-Hill Education