
MATLAB: An Introduction with Applications
6th Edition
ISBN: 9781119256830
Author: Amos Gilat
Publisher: John Wiley & Sons Inc
expand_more
expand_more
format_list_bulleted
Related questions
Question
5
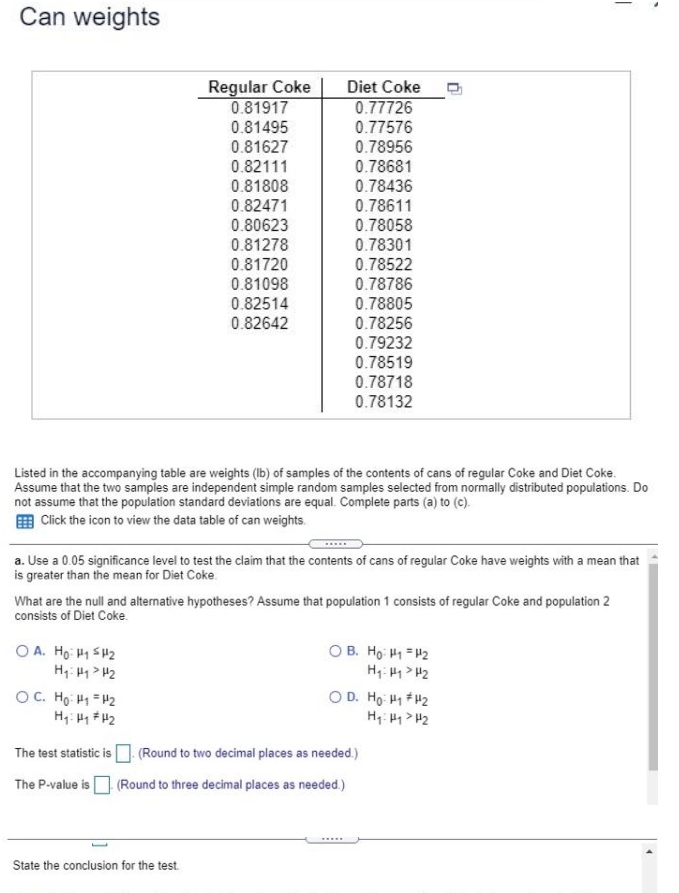

Transcribed Image Text:Can weights
Regular Coke
0.81917
Diet Coke
0.77726
0.77576
0.78956
0.81495
0.81627
0.82111
0.81808
0.78681
0.78436
0.82471
0.80623
0.78611
0.78058
0.78301
0.81278
0.81720
0.78522
0.78786
0.81098
0.82514
0.82642
0.78805
0.78256
0.79232
0.78519
0.78718
0.78132
Listed in the accompanying table are weights (Ib) of samples of the contents of cans of regular Coke and Diet Coke.
Assume that the two samples are independent simple random samples selected from normally distributed populations. Do
not assume that the population standard deviations are equal. Complete parts (a) to (c).
E Click the icon to view the data table of can weights.
a. Use a 0.05 significance level to test the claim that the contents of cans of regular Coke have weights with a mean that
is greater than the mean for Diet Coke.
What are the null and alternative hypotheses? Assume that population 1 consists of regular Coke and population 2
consists of Diet Coke.
O A. Ho: H1 SH2
O B. Ho: H1 = 42
H: H1 > H2
O D. Ho H1 *H2
OC. Ho H1 = H2
대< H H
The test statistic is O (Round to two decimal places as needed.)
The P-value is (Round to three decimal places as needed)
State the conclusion for the test.

Transcribed Image Text:O A. Fail to reject the null hypothesis. There is sufficient evidence to support the claim that cans of regular Coke
have weights with a mean that is greater than the mean for Diet Coke
O B. Reject the null hypothesis. There is sufficient evidence to support the claim that cans of regular Coke have
weights with a mean that is greater than the mean for Diet Coke.
OC. Fail to reject the null hypothesis. There is not sufficient evidence to support the claim that cans of regular Coke
have weights with a mean that is greater than the mean for Diet Coke.
O D. Reject the null hypothesis. There is not sufficient evidence to support the claim that cans of regular Coke have
weights with a mean that is greater than the mean for Diet Coke.
b. Construct the confidence interval appropriate for the hypothesis test in part (a).
(Round to five decimal places as needed.)
c. Can you explain why cans of regular Coke would weigh more than cans of Diet Coke?
O A. Cans of regular Coke probably weigh more than cans of Diet Coke due to Diet Coke cans being only half as
large as regular Coke cans.
O B. Cans of regular Coke probably weigh more than cans of Diet Coke due to the extra metal present in a regular
Coke can but not a Diet Coke can.
Oc. Cans of regular Coke probably weigh more than cans of Diet Coke due to the sugar present in regular Coke but
not Diet Coke.
O D. There is no reason why they would have different weights.
Expert Solution
This question has been solved!
Explore an expertly crafted, step-by-step solution for a thorough understanding of key concepts.

This is a popular solution

Trending nowThis is a popular solution!

Step by stepSolved in 5 steps

Knowledge Booster

Similar questions
- Suppose the monthly charges for cell phone plans are normally distributed with mean μ=$57 and standard deviation σ=$18. (a) Draw a normal curve with the parameters labeled. (b) Shade the region that represents the proportion of plans that charge less than $39. (c) Suppose the area under the normal curve to the left of X=$39 is 0.1587. Provide an interpretation of this result. (a) Choose the correct graph below.arrow_forward2.763-4.5(2.1x-5.1432)=6.32x+5arrow_forward5 2/5+ n= 75/6arrow_forward
arrow_back_ios
SEE MORE QUESTIONS
arrow_forward_ios
Recommended textbooks for you
- MATLAB: An Introduction with ApplicationsStatisticsISBN:9781119256830Author:Amos GilatPublisher:John Wiley & Sons Inc
 Probability and Statistics for Engineering and th...StatisticsISBN:9781305251809Author:Jay L. DevorePublisher:Cengage Learning
 Statistics for The Behavioral Sciences (MindTap C...StatisticsISBN:9781305504912Author:Frederick J Gravetter, Larry B. WallnauPublisher:Cengage Learning
  Elementary Statistics: Picturing the World (7th E...StatisticsISBN:9780134683416Author:Ron Larson, Betsy FarberPublisher:PEARSON
 The Basic Practice of StatisticsStatisticsISBN:9781319042578Author:David S. Moore, William I. Notz, Michael A. FlignerPublisher:W. H. Freeman
 Introduction to the Practice of StatisticsStatisticsISBN:9781319013387Author:David S. Moore, George P. McCabe, Bruce A. CraigPublisher:W. H. Freeman
MATLAB: An Introduction with Applications
Statistics
ISBN:9781119256830
Author:Amos Gilat
Publisher:John Wiley & Sons Inc
Probability and Statistics for Engineering and th...
Statistics
ISBN:9781305251809
Author:Jay L. Devore
Publisher:Cengage Learning
Statistics for The Behavioral Sciences (MindTap C...
Statistics
ISBN:9781305504912
Author:Frederick J Gravetter, Larry B. Wallnau
Publisher:Cengage Learning
Elementary Statistics: Picturing the World (7th E...
Statistics
ISBN:9780134683416
Author:Ron Larson, Betsy Farber
Publisher:PEARSON
The Basic Practice of Statistics
Statistics
ISBN:9781319042578
Author:David S. Moore, William I. Notz, Michael A. Fligner
Publisher:W. H. Freeman
Introduction to the Practice of Statistics
Statistics
ISBN:9781319013387
Author:David S. Moore, George P. McCabe, Bruce A. Craig
Publisher:W. H. Freeman