
A First Course in Probability (10th Edition)
10th Edition
ISBN: 9780134753119
Author: Sheldon Ross
Publisher: PEARSON
expand_more
expand_more
format_list_bulleted
Related questions
Question
Identify the p value and state the final conclusion

Transcribed Image Text:K
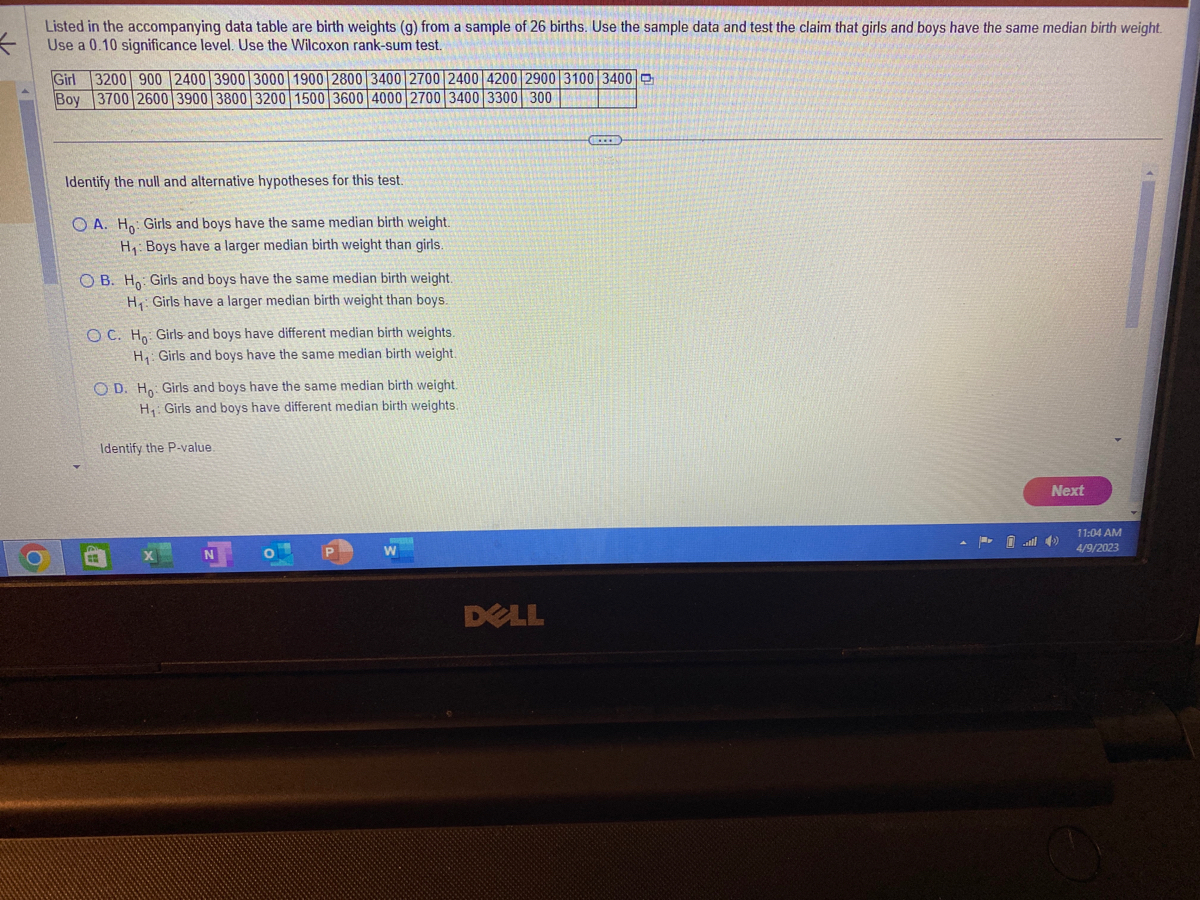
Listed in the accompanying data table are birth weights (g) from a sample of 26 births. Use the sample data and test the claim that girls and boys have the same median birth weight.
Use a 0.10 significance level. Use the Wilcoxon rank-sum test.
Girl 3200 900 2400 3900 3000 1900 2800 3400 2700 2400 4200 2900 3100 3400
Boy 3700 2600 3900 3800 3200 1500 3600 4000 2700 3400 3300 300
Identify the null and alternative hypotheses for this test.
OA. Ho: Girls and boys have the same median birth weight.
H₁: Boys have a larger median birth weight than girls.
OB. Ho: Girls and boys have the same median birth weight.
H₁: Girls have a larger median birth weight than boys.
OC. Ho Girls and boys have different median birth weights.
H₁: Girls and boys have the same median birth weight.
OD. Ho Girls and boys have the same median birth weight.
H₁: Girls and boys have different median birth weights.
Identify the P-value
N
DELL
E
Next
11:04 AM
4/9/2023
Expert Solution
This question has been solved!
Explore an expertly crafted, step-by-step solution for a thorough understanding of key concepts.

This is a popular solution

Trending nowThis is a popular solution!

Step by stepSolved in 6 steps with 13 images

Knowledge Booster

Similar questions
- Twelve friends are to arrange themselves in a straight line for a group photo. How many ways can these twelve people arrange themselves? A. 5,040 B. 12 C. 95,040 D. 479,001,600arrow_forwardGiven M₁ = -7, M₂ = -9, N = 28, and sp = 2.90, calculate t. ementing the decision rulearrow_forwardMatch these values of r with the accompanying scatterplots: 1, - 0.996, - 0.743, 0.996, and 0.358. Click the icon to view the scatterplots. i Scatterplots Match the values of r to the scatterplots. Scatterplot 1, r = Scatterplot 2, r = Scatterplot 1 Scatterplot 2 Scatterplot 3 Scatterplot 3, r = 15- 0- 8- . Scatterplot 4, r= 14- -2- 6- 13- Scatterplot 5, r= -4- 4- 12- -6– 11- 2- -8- 1 104 0- 0.2 0.4 0.6 0.8 1 0.2 0.4 0.6 0.8 1 0.2 0.4 0.6 0.8 1 - 0.743 0.996 Scatterplot 4 Scatterplot 5 - 0.996 8- 8- 0.358 6- 6- > 4- 4- 2- 2- 0+ 0- 0.2 0.4 0.6 0.8 1 0.2 0.4 0.6 0.8 1arrow_forward
- Q2.) The average of 18 numbers is 76. The difference between the largest number and the smallest number is 122. If the largest and the smallest are excluded the average becomes 74. What is the largest number among the 18 numbers?arrow_forwardIf X =125, o=24, and n = 36, construct construct a %3Darrow_forwardA student takes a true-false test that has 13 questions and guesses randomly at each answer. Let X be the number of questions answered correctly. Find P(11 or more)arrow_forward
- During COVID-19 pandemic, Armondo helped his community by making tacos to give to hospital personnel. Some tacos had pork filling and some had beef filling. He made a total of 600 tacos, and made 60 more beef tacos than pork tacos. How many of each type of taco did he make?arrow_forwardMatch these values of r with the accompanying scatterplots: 0.465, - 0.465, - 0.797, 1, and 0.797. Click the icon to view the scatterplots. Match the values of r to the scatterplots. Scatterplot 1, r= Scatterplots Scatterplot 2, r= Scatterplot 3, r= Scatterplot 4, r Scatterplot 1 Scatterplot 2 Scat Scatterplot 5, r= 8- 15- 14- 6- 6- 13- >4. 12 2- 2- 11- O 02 04 o's o8 i 04 6 02 04 os o'8 10 0.2 o4 Satterplot 4 Scatterplot 5 8- 6- >4. 2- 6 02 o4 o's o's 04 o o2 04 o's o's Print Done of ofarrow_forward
arrow_back_ios
arrow_forward_ios
Recommended textbooks for you
- A First Course in Probability (10th Edition)ProbabilityISBN:9780134753119Author:Sheldon RossPublisher:PEARSON

A First Course in Probability (10th Edition)
Probability
ISBN:9780134753119
Author:Sheldon Ross
Publisher:PEARSON