
MATLAB: An Introduction with Applications
6th Edition
ISBN: 9781119256830
Author: Amos Gilat
Publisher: John Wiley & Sons Inc
expand_more
expand_more
format_list_bulleted
Related questions
Question
Please help I need in an hour Thankyou so much
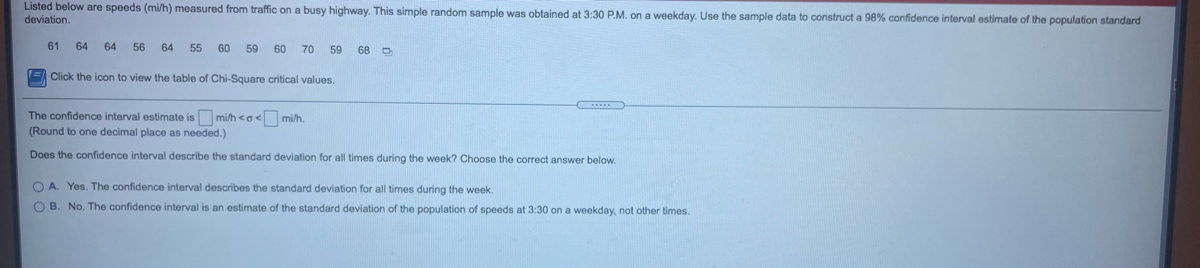

Transcribed Image Text:Listed below are speeds (mi/h) measured from traffic on a busy highway. This simple random sample was obtained at 3:30 P.M. on a weekday. Use the sample data to construct a 98% confidence interval estimate of the population standard
deviation.
61
64
64
56
64 55
60
59
60
70
59
68 D
= Click the icon to view the table of Chi-Square critical values.
The confidence interval estimate is mi/h <o< mi/h.
(Round to one decimal place as needed.)
Does the confidence interval describe the standard deviation for all times during the week? Choose the correct answer below.
O A. Yes. The confidence interval describes the standard deviation for all times during the week.
O B. No. The confidence interval is an estimate of the standard deviation of the population of speeds at 3:30 on a weekday, not other times.

Transcribed Image Text:Listed below are spe
Area to the right of the critical value
bulatic
deviation.
61
64 64
Chi-Square (X2) Distribution
Click the icon to
Area to the Right of the Critical Value
Degrees of
Freedom
Degrees of
Freedom
The confidence inter
0.995
0.99
0.975
0.95
0.90
0.10
0.05
0.025
0.01
0.005
(Round to one decim
0.001
0.004
0.016
2.706
3.841
5.024
6.635
7.879
1.
Does the confidence
2
0.010
0.020
0.051
0.103
0.211
4.605
5.991
7.378
9.210
10.597
O A. Yes. The con
0.072
0.115
0.216
0.352
0.584
6.251
7.815
9.348
11.345
12.838
3
4.
0.207
0.297
0.484
0.711
1.064
7.779
9.488
11.143
13.277
14.860
4.
O B. No. The confi
0.412
0.554
0.831
1.145
1.610
9.236
11.071
12.833
15.086
16.750
0.676
0.872
1.237
1.635
2.204
10.645
12.592
14.449
16.812
18.548
6.
7
0.989
1.239
1.690
2.167
2.833
12.017
14.067
16.013
18.475
20.278
7
8.
1.344
1.646
2.180
2.733
3.490
13.362
15.507
17.535
20.090
21.955
8.
9
1.735
2.088
2.700
3.325
4.168
14.684
16.919
19.023
21.666
23.589
10
2.156
2.558
3.247
3.940
4.865
15.987
18.307
20.483
23.209
25.188
10
11
2.603
3.053
3.816
4.575
5.578
17.275
19.675
21.920
24.725
26.757
11
Expert Solution
This question has been solved!
Explore an expertly crafted, step-by-step solution for a thorough understanding of key concepts.

This is a popular solution

Trending nowThis is a popular solution!

Step by stepSolved in 4 steps with 2 images

Knowledge Booster

Similar questions
- Hello, please answer all parts if possible. if not, please answer c, e and f, thank you.arrow_forwardFind volumearrow_forwardResearchers wants to determine if low-fat diets or low-carb diets are more effective for weight loss. Suppose 100 people were placed on a low-fat diet and at the end of 3 months the mean weight loss was 10.5 lbs witha standard deviation of 12.5 lbs. There were another 100 people placed on a low-carb diet and at the end of 3 months the mean weight loss was 16.5 lbs with a standard deviation of 10.2 lbs. Does mean weight lossdiffer between the two diets? What are the hypotheses??arrow_forward
Recommended textbooks for you
- MATLAB: An Introduction with ApplicationsStatisticsISBN:9781119256830Author:Amos GilatPublisher:John Wiley & Sons Inc
 Probability and Statistics for Engineering and th...StatisticsISBN:9781305251809Author:Jay L. DevorePublisher:Cengage Learning
 Statistics for The Behavioral Sciences (MindTap C...StatisticsISBN:9781305504912Author:Frederick J Gravetter, Larry B. WallnauPublisher:Cengage Learning
  Elementary Statistics: Picturing the World (7th E...StatisticsISBN:9780134683416Author:Ron Larson, Betsy FarberPublisher:PEARSON
 The Basic Practice of StatisticsStatisticsISBN:9781319042578Author:David S. Moore, William I. Notz, Michael A. FlignerPublisher:W. H. Freeman
 Introduction to the Practice of StatisticsStatisticsISBN:9781319013387Author:David S. Moore, George P. McCabe, Bruce A. CraigPublisher:W. H. Freeman
MATLAB: An Introduction with Applications
Statistics
ISBN:9781119256830
Author:Amos Gilat
Publisher:John Wiley & Sons Inc
Probability and Statistics for Engineering and th...
Statistics
ISBN:9781305251809
Author:Jay L. Devore
Publisher:Cengage Learning
Statistics for The Behavioral Sciences (MindTap C...
Statistics
ISBN:9781305504912
Author:Frederick J Gravetter, Larry B. Wallnau
Publisher:Cengage Learning
Elementary Statistics: Picturing the World (7th E...
Statistics
ISBN:9780134683416
Author:Ron Larson, Betsy Farber
Publisher:PEARSON
The Basic Practice of Statistics
Statistics
ISBN:9781319042578
Author:David S. Moore, William I. Notz, Michael A. Fligner
Publisher:W. H. Freeman
Introduction to the Practice of Statistics
Statistics
ISBN:9781319013387
Author:David S. Moore, George P. McCabe, Bruce A. Craig
Publisher:W. H. Freeman