
MATLAB: An Introduction with Applications
6th Edition
ISBN: 9781119256830
Author: Amos Gilat
Publisher: John Wiley & Sons Inc
expand_more
expand_more
format_list_bulleted
Related questions
Concept explainers
Question
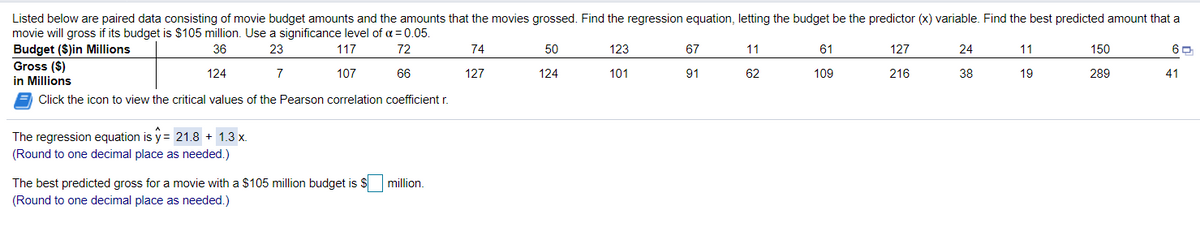

Transcribed Image Text:Listed below are paired data consisting of movie budget amounts and the amounts that the movies grossed. Find the regression equation, letting the budget be the predictor (x) variable. Find the best predicted amount that a
movie will gross if its budget is $105 million. Use a significance level of a = 0.05.
Budget ($)in Millions
Gross ($)
in Millions
36
23
117
72
74
50
123
67
11
61
127
24
11
150
124
7
107
66
127
124
101
91
62
109
216
38
19
289
41
Click the icon to view the critical values of the Pearson correlation coefficient r.
The regression equation is y= 21.8 + 1.3 x.
(Round to one decimal place as needed.)
The best predicted gross for a movie with a $105 million budget is $ million.
(Round to one decimal place as needed.)
Expert Solution
This question has been solved!
Explore an expertly crafted, step-by-step solution for a thorough understanding of key concepts.

This is a popular solution

Trending nowThis is a popular solution!

Step by stepSolved in 2 steps with 2 images

Knowledge Booster


Learn more about
Need a deep-dive on the concept behind this application? Look no further. Learn more about this topic, statistics and related others by exploring similar questions and additional content below.Similar questions
- The personnel director of a large hospital is interested in determining the relationship (if any) between an employee’s age and the number of sick days the employee takes per year. The director randomly selects ten employees and records their age and the number of sick days which they took in the previous year. Employee 1 2 3 4 5 6 7 8 9 10 Age 30 50 40 55 30 28 60 25 30 45 Sick Days 7 4 3 2 9 10 0 8 5 2 Copy Data The estimated regression line and the standard error are given. Sick Days=14.310162−0.2369(Age) se=1.682207se=1.682207 Find the 95% confidence interval for the average number of sick days an employee will take per year, given the employee is 26. Round your answer to two decimal places.arrow_forwardListed below are paired data consisting of movie budget amounts and the corresponding amounts that the movies grossed. Find the regression equation, letting the budget be the predictor (x) variable. Find the best predicted amount that a movie will gross if its budget is $125 million. Use a significance level of alpha = 0.05. %3D Budget ($) in Millions 38 116 71 67 9. 60 120 154 Gross ($) in 108 103 129 110 54 96 212 287 Millions O A. The regression equation is y = 30.9 + 1.3x; Best predicted gross of $137.4 million В. The regression equation is y = 1.3 + 30.9x; Best predicted gross of $3863.8 million C. The regression equation is y = 1.3 + 30.9x; Best predicted gross of $137.4 million D. The regression equation is y = 30.9 + 1.3x; Best predicted gross of $193.4 million Click to select your answer. ?arrow_forwardThis table shows the minutes students spent studying for their science exam and the scores they received. Study time (min) 19 12 34 10 17 42 60 15 9 21 30 50 Exam score 82 78 90 78 85 97 100 85 73 90 91 98 Use a graphing calculator to model the data using a linear function. What is the correlation coefficient of the data? −0.74 −0.48 0.93 0.98arrow_forward
- Listed. below are paired data consisting of movie budget amounts and the amounts that the movies grossed. Find the regression equation, letting the budget be the predictor (x) variable. Find the best predicted amount that a movie will gross if its budget is $115 million. Use a significance level of a = 0.05. Budget ($)in Millions Gross ($) in Millions 41 21 114 68 79 51 118 65 9. 61 122 21 15 151 110 119 11 107 56 128 116 101 107 55 105 222 39 22 283 45 Click the icon to view the critical values of the Pearson correlation coefficient r. The regression equation is y%= X. %3D (Round to one decimal place as needed.)arrow_forwardA. run a simple regression- dependent variable is Weeks, independent variable is Age. B. run a multiple regression with dependent variable weeks and independent variable-age, married, head, manager and sales. C. Create the regular and standardized residual plots for both. Please show the tables when entering values of the regression for both the outputs and the scatter plots.arrow_forwardThe datasetBody.xlsgives the percent of weight made up of body fat for 100 men as well as other variables such as Age, Weight (lb), Height (in), and circumference (cm) measurements for the Neck, Chest, Abdomen, Ankle, Biceps, and Wrist. We are interested in predicting body fat based on abdomen circumference. Find the equation of the regression line relating to body fat and abdomen circumference. Make a scatter-plot with a regression line. What body fat percent does the line predict for a person with an abdomen circumference of 110 cm? One of the men in the study had an abdomen circumference of 92.4 cm and a body fat of 22.5 percent. Find the residual that corresponds to this observation. Bodyfat Abdomen 32.3 115.6 22.5 92.4 22 86 12.3 85.2 20.5 95.6 22.6 100 28.7 103.1 21.3 89.6 29.9 110.3 21.3 100.5 29.9 100.5 20.4 98.9 16.9 90.3 14.7 83.3 10.8 73.7 26.7 94.9 11.3 86.7 18.1 87.5 8.8 82.8 11.8 83.3 11 83.6 14.9 87 31.9 108.5 17.3…arrow_forward
- Listed below are paired data consisting of movie budget amounts and the amounts that the movies grossed. Find the regression equation, letting the budget be the predictor (x) variable. Find the best predicted amount that a movie will gross if its budget is $110 million. Use a significance level of alpha equals 0.05 . Budget left parenthesis $ right parenthesis in Millions 42 24 119 69 77 48 121 62 5 63 129 21 12 154 4 Gross left parenthesis $ right parenthesis in Millions 117 16 112 66 111 111 104 90 62 104 219 27 20 288 42 The regression equation is ŷ = __ + __x. (Round to one decimal place as needed.) The linear coefficient of correlation r = ___ (Round to three decimal places as needed.) The critical value of r = ____ The best predicted gross for a move with a $110 million budget is _____.arrow_forwardIs It Getting Harder to Win a Hot Dog Eating Contest?Every Fourth of July, Nathan’s Famous in New York City holds a hot dog eating contest. The table below shows the winning number of hot dogs and buns eaten every year from 2002 to 2015, and the data are also available in HotDogs. The figure below shows the scatterplot with the regression line. Year Hot Dogs 2015 62 2014 61 2013 69 2012 68 2011 62 2010 54 2009 68 2008 59 2007 66 2006 54 2005 49 2004 54 2003 45 2002 50 Winning number of hot dogs in the hot dog eating contest Winning number of hot dogs and buns Click here for the dataset associated with this question. (a) Is the trend in the data mostly positive or negative? Positive Negative (b) Using the figure provided, is the residual larger in 2007 or 2008?Choose the answer from the menu in accordance to item (b) of the question statement 20072008 Is the residual positive or…arrow_forwardListed below are paired data consisting of movie budget amounts and the amounts that the movies grossed. Find the regression equation, letting the budget be the predictor (x) variable. Find the best predicted amount that a movie will gross if its budget is $120 million. Use a significance level of a = 0.05. Budget ($)in Millions Gross ($) in Millions 40 20 118 67 71 48 119 62 8. 64 128 18 11 147 4 O 115 21 112 67 120 119 93 102 51 114 219 34 11 287 43 Click the icon to view the critical values of the Pearson correlation coefficient r. В... The regression equation is y =+x. (Round to one decimal place as needed.)arrow_forward
- 5. The table below shows varying prices of music sold on a streaming service. Determine the linear regression to estimate the weekly sales of albums sold, use your regression to estimate the weekly sales if the price is $9 per album, and state the correlation coefficient, r, and interpret its meaning in the context of this problem. Price ($) Weekly sales (in thousands) $8 440 $8.50 380 $10 $11.50 250 180arrow_forward15. Listed below are paired data consisting of movie budget amounts and the amounts that the movies grossed. Find the regression equation, letting the budget be the predictor (x) variable. Find the best predicted amount that a movie will gross if its budget is $115 million. Use a significance level of a = 0.05. Budget ($)in Millions Gross ($) in Millions %3D 39 23 117 70 70 49 122 62 64 122 20 11 149 111 18 104 68 129 116 98 95 60 113 208 40 22 288 48 8. Click the icon to view the critical values of the Pearson correlation coefficient r. The regression equation is y = (Round to one decimal place as needed.) х. The best predicted gross for a movie with a $115 million budget is $ million. (Round to one decimal place as needed.)arrow_forwardListed below are paired data consisting of movie budget amounts and the amounts that the movies grossed. Find the regression equation, letting the budget be the predictor (x) variable. Find the best predicted amount that a movie will gross if its budget is $140 million. Use a significance level of a = 0.05. Budget ($)in Millions Gross ($) in Millions 39 22 118 67 77 49 124 66 12 64 128 19 6. 147 9. 118 6. 99 75 127 107 95 99 64 109 209 44 8 293 48 Click the icon to view the critical values of the Pearson correlation coefficient r. The regression equation is y =+x. (Round to one decimal place as needed.)arrow_forward
arrow_back_ios
SEE MORE QUESTIONS
arrow_forward_ios
Recommended textbooks for you
- MATLAB: An Introduction with ApplicationsStatisticsISBN:9781119256830Author:Amos GilatPublisher:John Wiley & Sons Inc
 Probability and Statistics for Engineering and th...StatisticsISBN:9781305251809Author:Jay L. DevorePublisher:Cengage Learning
 Statistics for The Behavioral Sciences (MindTap C...StatisticsISBN:9781305504912Author:Frederick J Gravetter, Larry B. WallnauPublisher:Cengage Learning
  Elementary Statistics: Picturing the World (7th E...StatisticsISBN:9780134683416Author:Ron Larson, Betsy FarberPublisher:PEARSON
 The Basic Practice of StatisticsStatisticsISBN:9781319042578Author:David S. Moore, William I. Notz, Michael A. FlignerPublisher:W. H. Freeman
 Introduction to the Practice of StatisticsStatisticsISBN:9781319013387Author:David S. Moore, George P. McCabe, Bruce A. CraigPublisher:W. H. Freeman
MATLAB: An Introduction with Applications
Statistics
ISBN:9781119256830
Author:Amos Gilat
Publisher:John Wiley & Sons Inc
Probability and Statistics for Engineering and th...
Statistics
ISBN:9781305251809
Author:Jay L. Devore
Publisher:Cengage Learning
Statistics for The Behavioral Sciences (MindTap C...
Statistics
ISBN:9781305504912
Author:Frederick J Gravetter, Larry B. Wallnau
Publisher:Cengage Learning
Elementary Statistics: Picturing the World (7th E...
Statistics
ISBN:9780134683416
Author:Ron Larson, Betsy Farber
Publisher:PEARSON
The Basic Practice of Statistics
Statistics
ISBN:9781319042578
Author:David S. Moore, William I. Notz, Michael A. Fligner
Publisher:W. H. Freeman
Introduction to the Practice of Statistics
Statistics
ISBN:9781319013387
Author:David S. Moore, George P. McCabe, Bruce A. Craig
Publisher:W. H. Freeman