
MATLAB: An Introduction with Applications
6th Edition
ISBN: 9781119256830
Author: Amos Gilat
Publisher: John Wiley & Sons Inc
expand_more
expand_more
format_list_bulleted
Related questions
Question
-What is test statistics?
-What is the P value?
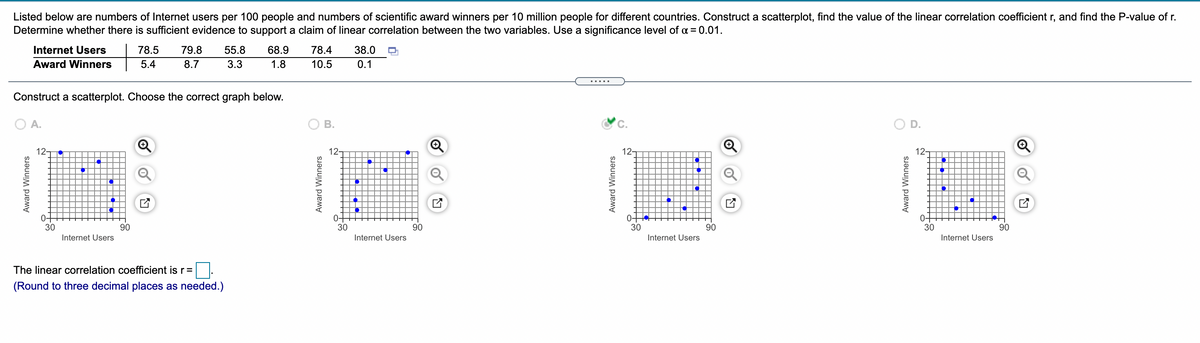

Transcribed Image Text:Listed below are numbers of Internet users per 100 people and numbers of scientific award winners per 10 million people for different countries. Construct a scatterplot, find the value of the linear correlation coefficient r, and find the P-value of r.
Determine whether there is sufficient evidence to support a claim of linear correlation between the two variables. Use a significance level of a = 0.01.
Internet Users
78.5
79.8
55.8
68.9
78.4
38.0
Award Winners
5.4
8.7
3.3
1.8
10.5
0.1
.....
Construct a scatterplot. Choose the correct graph below.
A.
В.
D.
12-
12-
12-
12-
0-
30
0-
30
0-
30
0-
30
90
90
90
90
Internet Users
Internet Users
Internet Users
Internet Users
The linear correlation coefficient is r=
(Round to three decimal places as needed.)
Award Winners
Award Winners
Award Winners
Award Winners
Expert Solution
This question has been solved!
Explore an expertly crafted, step-by-step solution for a thorough understanding of key concepts.

This is a popular solution

Trending nowThis is a popular solution!

Step by stepSolved in 4 steps with 1 images

Knowledge Booster

Similar questions
- LICENSE x ED COURSE, PART 4 of 4. What is your statistical decision? The following 2 X 2 chart represents whether high school students passed the road test for their driver’s license on the first attempt by whether they took a driver’s education course. What is your statistical decision?arrow_forwardWhat is p? What happens to type 1 and type 2 error when you raise and lower your p-value?arrow_forwardWe would like to investigate if there is a difference in mean coffee consumption frequency between students at Rutgers, Princeton, and the University of Michigan. What test would we likely conduct? Independent samples t-test One Sample z-test Paired samples t-test One Way ANOVAarrow_forward
- why we sample and what are some of the methods to do so? Can you give me any examples? Can population mean and sample mean be the same?arrow_forwardSummarize the similarities and differences between the one-sample t test, independent-measures t test, and repeated-measure t test.arrow_forward-what kinds of questions can we test with a t test? -How do you know if two samples are statistically different from each other? In other words, what statistics will tell you if your results are statistically significant?arrow_forward
- "What i v nighest level of education you've completed?" and "If you're employed full-time, how many hours do you spend working at your job during a typical week?" In a recent year, 1125 respondents answered both questions. The summary statistics are given in the chart below. (The sample data consist of the times, in hours per week, that were given by the respondents.) Sample Sample Sample size Groups mean variance Less than h.s. 257 43.1 110.1 High school 292 44.2 84.9 Bachelor's 294 42.7 105.8 Graduate 282 43.6 100.8 Send data to calculator Send data to Excel To decide if there are any differences in the mean hours per week worked by these different groups, we can perform a one-way, independent-samples ANOVA test. Such a test uses the following statistic. Variation between the samples F = Variation within the samples For the data from the survey, F - 1.22. (a) Give the p-value corresponding to this value of the F statistic. Round your answer to at least three decimal places. (b) From…arrow_forwardwhat is the value of the test statistic for this test?arrow_forwardz Scores LeBron James, one of the most successful basketball players of all time, has a height of 6 feet 8 inches, or 203 cm. Based on statistics from Data Set 1 “Body Data” in Appendix B, his height converts to the z score of 4.07. How many standard deviations is his height above the mean?arrow_forward
arrow_back_ios
arrow_forward_ios
Recommended textbooks for you
- MATLAB: An Introduction with ApplicationsStatisticsISBN:9781119256830Author:Amos GilatPublisher:John Wiley & Sons Inc
 Probability and Statistics for Engineering and th...StatisticsISBN:9781305251809Author:Jay L. DevorePublisher:Cengage Learning
 Statistics for The Behavioral Sciences (MindTap C...StatisticsISBN:9781305504912Author:Frederick J Gravetter, Larry B. WallnauPublisher:Cengage Learning
  Elementary Statistics: Picturing the World (7th E...StatisticsISBN:9780134683416Author:Ron Larson, Betsy FarberPublisher:PEARSON
 The Basic Practice of StatisticsStatisticsISBN:9781319042578Author:David S. Moore, William I. Notz, Michael A. FlignerPublisher:W. H. Freeman
 Introduction to the Practice of StatisticsStatisticsISBN:9781319013387Author:David S. Moore, George P. McCabe, Bruce A. CraigPublisher:W. H. Freeman
MATLAB: An Introduction with Applications
Statistics
ISBN:9781119256830
Author:Amos Gilat
Publisher:John Wiley & Sons Inc
Probability and Statistics for Engineering and th...
Statistics
ISBN:9781305251809
Author:Jay L. Devore
Publisher:Cengage Learning
Statistics for The Behavioral Sciences (MindTap C...
Statistics
ISBN:9781305504912
Author:Frederick J Gravetter, Larry B. Wallnau
Publisher:Cengage Learning
Elementary Statistics: Picturing the World (7th E...
Statistics
ISBN:9780134683416
Author:Ron Larson, Betsy Farber
Publisher:PEARSON
The Basic Practice of Statistics
Statistics
ISBN:9781319042578
Author:David S. Moore, William I. Notz, Michael A. Fligner
Publisher:W. H. Freeman
Introduction to the Practice of Statistics
Statistics
ISBN:9781319013387
Author:David S. Moore, George P. McCabe, Bruce A. Craig
Publisher:W. H. Freeman