MATLAB: An Introduction with Applications
6th Edition
ISBN: 9781119256830
Author: Amos Gilat
Publisher: John Wiley & Sons Inc
expand_more
expand_more
format_list_bulleted
Concept explainers
Question
thumb_up100%
need help with the linear
significance level of
alpha
equals0.05.

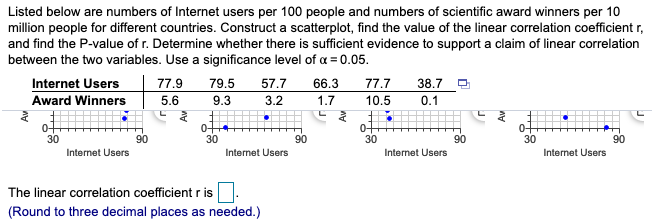
Transcribed Image Text:Listed below are numbers of Internet users per 100 people and numbers of scientific award winners per 10
million people for different countries. Construct a scatterplot, find the value of the linear correlation coefficient r,
and find the P-value of r. Determine whether there is sufficient evidence to support a claim of linear correlation
between the two variables. Use a significance level of a = 0.05.
77.7
10.5
79.5
9.3
66.3
1.7
Internet Users
Award Winners
77.9
5.6
57.7
3.2
38.7 D
0.1
30
30
30
30
90
90
90
90
Internet Users
Internet Users
Internet Users
Internet Users
The linear correlation coefficient r is
(Round to three decimal places as needed.)
Expert Solution
This question has been solved!
Explore an expertly crafted, step-by-step solution for a thorough understanding of key concepts.
This is a popular solution
Trending nowThis is a popular solution!
Step by stepSolved in 4 steps with 4 images

Knowledge Booster
Learn more about
Need a deep-dive on the concept behind this application? Look no further. Learn more about this topic, statistics and related others by exploring similar questions and additional content below.Similar questions
- Average Income 19320 17554 17310 15589 15266 15078 12749 9351 8866 4952 3627 3412 2554 2296 1871 1809 1710 1621 1345 1282 1171 1109 1091 810 585 Average Life Expectancy 76.25 75.3 78.65 75.51 76.19 76.36 73.73 73.9 76.38 71.16 64.19 74.35 57.53 56.64 62.71 57.34 54.98 46.93 52.24 53.44 60.99 57.21 49.99 45.91 60.03 In this practice assignment, you will use spreadsheet regression or the online regression calculator at http://www.alcula.com/calculators/statistics/linear- regression to examine the relationship between average annual income and average life expectancy in a country. This relationship is called the Preston curve. Open QR 8D Spreadsheet_Practice, which gives the average annual income and average life expectancy in 25 low-income countries. Each row corresponds to a country. Use technology (spreadsheet regression or the Alcula website given above) to create a scatterplot and regression equation for the Preston curve data. Round all answer values to the nearest ten thousandth…arrow_forwardCan you help me with the p-value I answered 0.034 which is incorrectarrow_forwardSuppose you will perform a test to determine whether there is sufficient evidencearrow_forward
- 20arrow_forwardPlease help it’s not gradedarrow_forwardA researcher at a large company has collected data on the beginning salary and current salary of 50 randomly selected employees. The correlation between the data sets is r = 0.912. The summary statistics from the data collected are shown bellow: Beginning Salary Ending Salary Mean x¯=56,340 y¯=82,070 Standard deviation Sx = 5,470 Sy = 7,800 Use a complete sentence to describe the strength and direction of the linear relationship between beginning salary and current salary. Find the equation of the least-squares regression line. (Round to two decimal places)arrow_forward
- please provide accurate answerarrow_forwardA researcher believes that low BMI levels are indicators of eating disorders. He collects BMI of a sample of young adults identified as at risk for eating disorfers to see if their mean BMI is significantly below 18.5 What test would you use and why? (z test, independent t test, single sample t test, paired samples)arrow_forwardChoose the appropriate statistical test. When computing, be sure to round each answer as indicated. A dentist wonders if depression affects ratings of tooth pain. In the general population, using a scale of 1-10 with higher values indicating more pain, the average pain rating for patients with toothaches is 6.8. A sample of 30 patients that show high levels of depression have an average pain rating of 7.1 (variance 0.8). What should the dentist determine? 1. Calculate the estimated standard error. (round to 3 decimals). [st.error] 2. What is thet-obtained? (round to 3 decimals). 3. What is the t-cv? (exact value) 4. What is your conclusion? Only type "Reject" or Retain"arrow_forward
arrow_back_ios
arrow_forward_ios
Recommended textbooks for you
 MATLAB: An Introduction with ApplicationsStatisticsISBN:9781119256830Author:Amos GilatPublisher:John Wiley & Sons Inc
 Probability and Statistics for Engineering and th...StatisticsISBN:9781305251809Author:Jay L. DevorePublisher:Cengage Learning
 Statistics for The Behavioral Sciences (MindTap C...StatisticsISBN:9781305504912Author:Frederick J Gravetter, Larry B. WallnauPublisher:Cengage Learning
 Elementary Statistics: Picturing the World (7th E...StatisticsISBN:9780134683416Author:Ron Larson, Betsy FarberPublisher:PEARSON
 The Basic Practice of StatisticsStatisticsISBN:9781319042578Author:David S. Moore, William I. Notz, Michael A. FlignerPublisher:W. H. Freeman
 Introduction to the Practice of StatisticsStatisticsISBN:9781319013387Author:David S. Moore, George P. McCabe, Bruce A. CraigPublisher:W. H. Freeman

MATLAB: An Introduction with Applications
Statistics
ISBN:9781119256830
Author:Amos Gilat
Publisher:John Wiley & Sons Inc

Probability and Statistics for Engineering and th...
Statistics
ISBN:9781305251809
Author:Jay L. Devore
Publisher:Cengage Learning

Statistics for The Behavioral Sciences (MindTap C...
Statistics
ISBN:9781305504912
Author:Frederick J Gravetter, Larry B. Wallnau
Publisher:Cengage Learning

Elementary Statistics: Picturing the World (7th E...
Statistics
ISBN:9780134683416
Author:Ron Larson, Betsy Farber
Publisher:PEARSON

The Basic Practice of Statistics
Statistics
ISBN:9781319042578
Author:David S. Moore, William I. Notz, Michael A. Fligner
Publisher:W. H. Freeman

Introduction to the Practice of Statistics
Statistics
ISBN:9781319013387
Author:David S. Moore, George P. McCabe, Bruce A. Craig
Publisher:W. H. Freeman