
MATLAB: An Introduction with Applications
6th Edition
ISBN: 9781119256830
Author: Amos Gilat
Publisher: John Wiley & Sons Inc
expand_more
expand_more
format_list_bulleted
Related questions
Topic Video
Question

Transcribed Image Text:9.3.2
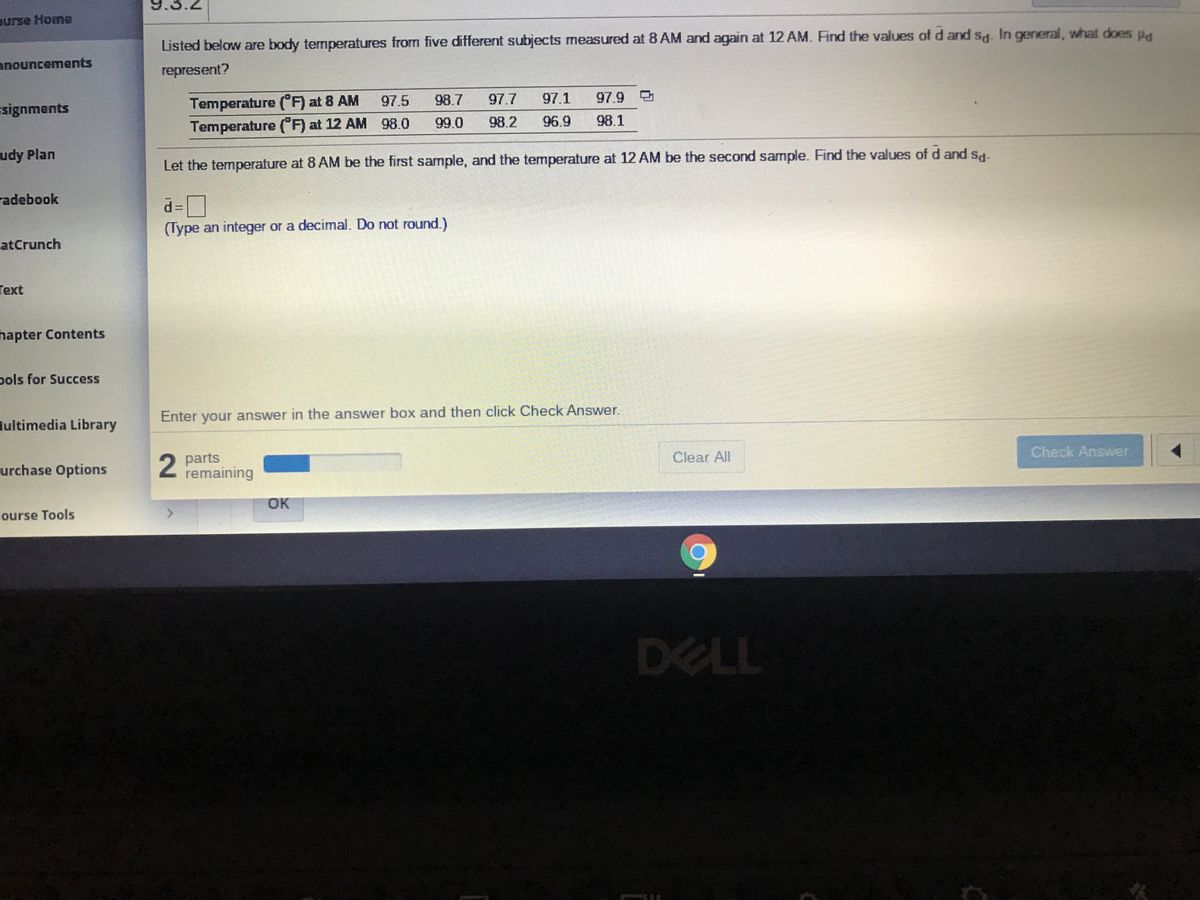
Listed below are body temperatures from five different subjects measured at 8 AM and again at 12 AM. Find the values of d and s,d. In general, hat does pt
anouncements
represent?
Temperature (F) at 8 AM
Temperature (F) at 12 AM 98.0
signments
97.5
98.7
97.7
97.1
97.9 3
99.0
98.2
96.9
98.1
udy Plan
Let the temperature at 8 AM be the first sample, and the temperature at 12 AM be the second sample. Find the values of d and sd-
radebook
(Type an integer or a decimal. Do not round.)
catCrunch
Text
hapter Contents
pols for Success
lultimedia Library
Enter your answer in the answer box and then click Check Answer.
2 parts
remaining
urchase Options
Clear All
Check Answer
OK
ourse Tools
DELL
Expert Solution
This question has been solved!
Explore an expertly crafted, step-by-step solution for a thorough understanding of key concepts.

This is a popular solution

Trending nowThis is a popular solution!

Step by stepSolved in 2 steps with 3 images

Knowledge Booster


Learn more about
Need a deep-dive on the concept behind this application? Look no further. Learn more about this topic, statistics and related others by exploring similar questions and additional content below.Similar questions
- 50arrow_forwardListed below are body temperatures from five different subjects measured at 8AM and again at 12 AM Find the values of d and y In general, what does P represent? Temperature ("F) at 8 AM 98 1 Temperature ("F at 12 AM 98.9 99 3 97.3 97.1 978 O 99 7 97 6 96.9 98 2 Let the temperature at 8 AM be the first sample, and the temperature at 12 AM be the second sample. Find the values of d and s (Type an integer or a decimal. Do not round)arrow_forwardThe following set of data represents the number of orders filled by a national-chain restaurant during a two week period. Construct a five number summary for the the data. 66, 75, 68, 89, 86, 73, 67, 75, 75, 82, 85, 74, 67, 61 (Round to the nearest hundredth, if needed). Min _________________ Lower Quartile _________________ Median __________________ Upper Quartile _________________ Maximum __________________ What is the range and the interquartile range (IQR)? Range __________________ Interquartile Range (IQR) ___________________arrow_forward
- Listed below are body temperatures from five different subjects measured at 8 AM and again at 12 AM. Find the values of d and so. In general, what does μ represent? Temperature (°F) at 8 AM 98.4 99.2 97.4 97.7 Temperature (°F) at 12 AM 99.1 97.5 D 99.8 97.8 97.5 97.7 Let the temperature at 8 AM be the first sample, and the temperature at 12 AM be the second sample. Find the values of d and s. d= (Type an integer or a decimal. Do not round.)arrow_forward3..arrow_forwardK Listed below are body temperatures from five different subjects measured at 8 AM and again at 12 AM. Find the values of d and sd. In general, what does μ represent? Temperature (°F) at 8 AM Temperature (°F) at 12 AM 98.1 97.5 99.2 97.5 97.4 99.5 98.0 97.2 97.7 D 98.0 Let the temperature at 8 AM be the first sample, and the temperature at 12 AM be the second sample. Find the values of d and s (Type an integer or a decimal. Do not round.)arrow_forward
- Refer to the table of sample values in Section 8.2 Exercise 10 of the text.Find the values of the UCL and LCL for the (x-bar) chart for this data, and round your answers to 3 places after the decimal point.arrow_forwardK Listed below are body temperatures from five different subjects measured at 8 AM and again at 12 AM. Find the values of d and sd. In general, what does represent? Temperature (°F) at 8 AM 98.2 99.4 97.5 97.1 97.6 D Temperature (°F) at 12 AM 98.7 100.1 97.8 96.9 97.9 Let the temperature at 8 AM be the first sample, and the temperature at 12 AM be the second sample. Find the values of d and sa d=-0,28 (Type an integer or a decimal. Do not round.)arrow_forwardThe population mean mu is a measure of A. Central tendency of a sample B. Central tendency of a populationC. Dispersion of a population D. The uncertainty of a population E. None of the abovearrow_forward
- D= SD= In general why does ud represent ?arrow_forwardWhat would the p-value be?arrow_forwardCitation Machine. 8 Healthcare Spendin. Otr A random sample of 10 temperatures in degrees Fahrenheit ('F) were drawn from April in Portland, OR. The data is shown below. Round your answer to 4 decimal places. Use technology, do not calculate the values by hand. ments Temperatue 117.6 133.5 98.2 127.3 ns 133.5 102.2 133.5 104.4 College Resources 118.6 110.6 Services Find s: Find 7: 117 9625 % of temperatures will fall between According to Chebyshev's Inequality: At least what 80.9509 F and 154.9291 F? Submit Question ! 71°F ere to searcharrow_forward
arrow_back_ios
arrow_forward_ios
Recommended textbooks for you
- MATLAB: An Introduction with ApplicationsStatisticsISBN:9781119256830Author:Amos GilatPublisher:John Wiley & Sons Inc
 Probability and Statistics for Engineering and th...StatisticsISBN:9781305251809Author:Jay L. DevorePublisher:Cengage Learning
 Statistics for The Behavioral Sciences (MindTap C...StatisticsISBN:9781305504912Author:Frederick J Gravetter, Larry B. WallnauPublisher:Cengage Learning
  Elementary Statistics: Picturing the World (7th E...StatisticsISBN:9780134683416Author:Ron Larson, Betsy FarberPublisher:PEARSON
 The Basic Practice of StatisticsStatisticsISBN:9781319042578Author:David S. Moore, William I. Notz, Michael A. FlignerPublisher:W. H. Freeman
 Introduction to the Practice of StatisticsStatisticsISBN:9781319013387Author:David S. Moore, George P. McCabe, Bruce A. CraigPublisher:W. H. Freeman
MATLAB: An Introduction with Applications
Statistics
ISBN:9781119256830
Author:Amos Gilat
Publisher:John Wiley & Sons Inc
Probability and Statistics for Engineering and th...
Statistics
ISBN:9781305251809
Author:Jay L. Devore
Publisher:Cengage Learning
Statistics for The Behavioral Sciences (MindTap C...
Statistics
ISBN:9781305504912
Author:Frederick J Gravetter, Larry B. Wallnau
Publisher:Cengage Learning
Elementary Statistics: Picturing the World (7th E...
Statistics
ISBN:9780134683416
Author:Ron Larson, Betsy Farber
Publisher:PEARSON
The Basic Practice of Statistics
Statistics
ISBN:9781319042578
Author:David S. Moore, William I. Notz, Michael A. Fligner
Publisher:W. H. Freeman
Introduction to the Practice of Statistics
Statistics
ISBN:9781319013387
Author:David S. Moore, George P. McCabe, Bruce A. Craig
Publisher:W. H. Freeman