
MATLAB: An Introduction with Applications
6th Edition
ISBN: 9781119256830
Author: Amos Gilat
Publisher: John Wiley & Sons Inc
expand_more
expand_more
format_list_bulleted
Related questions
Question
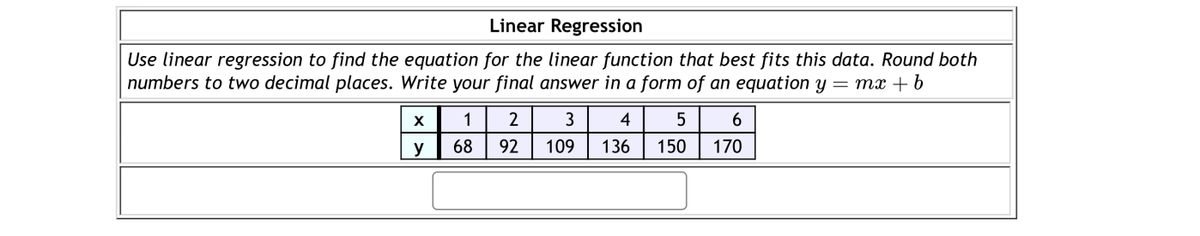

Transcribed Image Text:Linear Regression
Use linear regression to find the equation for the linear function that best fits this data. Round both
numbers to two decimal places. Write your final answer in a form of an equation y = mx + b
y
1
68
2
3
4
5
6
92
109
136
150
170
Expert Solution
This question has been solved!
Explore an expertly crafted, step-by-step solution for a thorough understanding of key concepts.

Step by stepSolved in 2 steps

Knowledge Booster

Similar questions
- Use linear regression on your calculator to find the equation of the linear function that best fits this data. 1 3 4 5 6 y 84 110 139 170 180 222 = mx + b. Round all numbers to 2 decimal Hint: Write your final answer as an equation in the form y places.arrow_forwardWhat is the dollar amount of change in sales for each new year according to the regression (slope) model? Do not use commas or $ in your answer.arrow_forwardUse linear regression to find the equation for the linear function that best fits this data. Round both numbers to two decimal places. Write your final answer in a form of an equation y= mx +b X y 1 92 2 110 4 5 3 139 160 171 6 196arrow_forward
- Given the data points listed below, use linear regression to find the expression y = %3D mx + b. List the slope of the best-fit line in the box below (round to one digit past the decimal point). y 2 2 3 15 5 14 8 55 |13 68 15 121arrow_forwardLet ŷ represent the profit (in thousands of dollars) for a certain company xx years after 1965. A statistician calculates a linear model ŷ = 0.38xx + 15Use the model to estimate the profit in 1973. Your answer should be in dollars, not thousands of dollars.Profit =$arrow_forwardUse the data shown in the graph to write a quadratic regression equation. Then predict the box office revenue in 2013. Let x represent the number of years since 2000. Millions of dollars 32- 189 31+ 30- Box office revenue 28.9 29.4 28.7 30.8 29- 28- 27- 2004 2005 2006 2007 2008 2009 Yeararrow_forward
- The value of your investment real estate, which is valued today at $231,000 , is projectedto appreciate to $270,000 in six years. Find the linear equation expressing the $ value V(t)of that real estate as a linear function of time t in yearsarrow_forwardThe following table shows retail sales in drug stores in billions of dollars in the U.S. for years since 1995. 220- 210 200 190 180 170 160 150 Year 0 130- 120- 110- 100- 90 801 6 12 15 Let S(t) be the retails sales in billions of dollars in t years since 1995. A linear model for the data is F(t) = 9.44t + 84.182. Retail Sales 85.851 108.426 141.781 169.256 202.297 222.266 3 6 9 12 15 Use the above scatter plot to decide whether the linear model fits the data well. The function is a good model for the data. The function is not a good model for the data Estimate the retails sales in the U. S. in 2015. billions of dollars.arrow_forwardThe data show the bug chirps per minute at different temperatures. Find the regression equation, letting the first variable be the independent (x) variable. Find the best predicted temperature for a time when a bug is chirping at the rate of 3000 chirps per minute. Use a significance level of 0.05. What is wrong with this predicted value? Chirps in 1 min 1118 796 1161 918 1103 1219 Temperature (F) 82 72.2 92.2 73 87.5 94.4arrow_forward
arrow_back_ios
arrow_forward_ios
Recommended textbooks for you
- MATLAB: An Introduction with ApplicationsStatisticsISBN:9781119256830Author:Amos GilatPublisher:John Wiley & Sons Inc
 Probability and Statistics for Engineering and th...StatisticsISBN:9781305251809Author:Jay L. DevorePublisher:Cengage Learning
 Statistics for The Behavioral Sciences (MindTap C...StatisticsISBN:9781305504912Author:Frederick J Gravetter, Larry B. WallnauPublisher:Cengage Learning
  Elementary Statistics: Picturing the World (7th E...StatisticsISBN:9780134683416Author:Ron Larson, Betsy FarberPublisher:PEARSON
 The Basic Practice of StatisticsStatisticsISBN:9781319042578Author:David S. Moore, William I. Notz, Michael A. FlignerPublisher:W. H. Freeman
 Introduction to the Practice of StatisticsStatisticsISBN:9781319013387Author:David S. Moore, George P. McCabe, Bruce A. CraigPublisher:W. H. Freeman
MATLAB: An Introduction with Applications
Statistics
ISBN:9781119256830
Author:Amos Gilat
Publisher:John Wiley & Sons Inc
Probability and Statistics for Engineering and th...
Statistics
ISBN:9781305251809
Author:Jay L. Devore
Publisher:Cengage Learning
Statistics for The Behavioral Sciences (MindTap C...
Statistics
ISBN:9781305504912
Author:Frederick J Gravetter, Larry B. Wallnau
Publisher:Cengage Learning
Elementary Statistics: Picturing the World (7th E...
Statistics
ISBN:9780134683416
Author:Ron Larson, Betsy Farber
Publisher:PEARSON
The Basic Practice of Statistics
Statistics
ISBN:9781319042578
Author:David S. Moore, William I. Notz, Michael A. Fligner
Publisher:W. H. Freeman
Introduction to the Practice of Statistics
Statistics
ISBN:9781319013387
Author:David S. Moore, George P. McCabe, Bruce A. Craig
Publisher:W. H. Freeman