MATLAB: An Introduction with Applications
6th Edition
ISBN: 9781119256830
Author: Amos Gilat
Publisher: John Wiley & Sons Inc
expand_more
expand_more
format_list_bulleted
Question

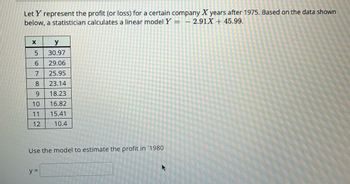
Transcribed Image Text:Let Y represent the profit (or loss) for a certain company X years after 1975. Based on the data shown
below, a statistician calculates a linear model Y = - 2.91X + 45.99.
X
5
6
7
8
9
10
11
12
y
30.97
29.06
25.95
23.14
18.23
16.82
15.41
10.4
Use the model to estimate the profit in 1980
y =
Expert Solution
This question has been solved!
Explore an expertly crafted, step-by-step solution for a thorough understanding of key concepts.
Step by stepSolved in 3 steps with 2 images

Knowledge Booster
Similar questions
- Fit a linear regression model for the following data.arrow_forwardGraph the scatterplot and find the equation of the regression line GDP. CO2 emissions (in millions metric tons) 1.7. 552.6 1.2. 462.3 2.5. 475.4 2.8. 374.3 3.6. 748.5 2.2. 400.9 0.8. 253.0 1.5. 318.6 2.4. 496.8 5.9. 1180.6arrow_forwardThe table shows the percents x and numbers y (in millions) of women in the work force for selected years. T 1970 1975 1980 1985 1990 1995 2000 2005 Percent, x 43.3 46.3 51.5 54.5 57.5 58.9 59.9 59.3 Number, y 31.5 37.5 45.5 51.1 56.8 60.9 66.3 69.3 Year (a) Use the regression capabilities of a graphing utility to find the least squares regression line for the data. (Round your coefficients to two decimal places) YM (b) According to this model, approximately how many women enter the labor force for each one-point increase in the percent of women in the labor force? (Round your answer to two decimal places.) million womenarrow_forward
- The following table gives estimates of the percent of a certain country's population below the poverty level for 1998–2008. Year Percent 1998 12.8 2000 11.2 2002 12.1 2004 12.7 2006 12.9 2008 13.2 Find the least squares line that relates years to percent below the poverty level. (Let x = 0 represent the year 1998. Enter a mathematical expression.arrow_forwardThe percentage of adults who smoke in America is given below. Year America 1970 37.4 mon n 1980 33.2 1990 25.3 2000 23.1 2010 19.4 a) Write the linear regression model for A(x), representing the percentage of adult smokers in America x years since 1970. [Use your calculator OR Desmos to find the equation, Round coefficients to the nearest 100"] b) What is the slope of A(x)? Explain its meaning. c) Solve A(x) = 15. Show your work. Explain the meaning of your answer. d) Suppose in 2005, there were approximately 200 million adults in America. Use your model to estimate how many were smokers. Show how you get your answer.arrow_forwardneed help with followingarrow_forward
- 2arrow_forwardThe average top ticket price for Broadway musicals has increased dramatically between 1975 and 2003. 1985 1998 2000 2003 72.83 118.97 130.15 44.99 Year Average Ticket Price 1975 13.63 a. Using the data in the table, find the linear regression equation that best fits the data. (Let x = 0 represent the number of years since 1970.) y = (Round values to three decimal places.) b. Predict the average top ticket price for Broadway musicals in the year 2012 if the price continues to increase at the same rate. (Let x represent the number of years since 1970.) (Round to two decimal places.) c. Find the rate at which the price is rising. per year (Round to two decimal places.)arrow_forward
arrow_back_ios
arrow_forward_ios
Recommended textbooks for you
 MATLAB: An Introduction with ApplicationsStatisticsISBN:9781119256830Author:Amos GilatPublisher:John Wiley & Sons Inc
 Probability and Statistics for Engineering and th...StatisticsISBN:9781305251809Author:Jay L. DevorePublisher:Cengage Learning
 Statistics for The Behavioral Sciences (MindTap C...StatisticsISBN:9781305504912Author:Frederick J Gravetter, Larry B. WallnauPublisher:Cengage Learning
 Elementary Statistics: Picturing the World (7th E...StatisticsISBN:9780134683416Author:Ron Larson, Betsy FarberPublisher:PEARSON
 The Basic Practice of StatisticsStatisticsISBN:9781319042578Author:David S. Moore, William I. Notz, Michael A. FlignerPublisher:W. H. Freeman
 Introduction to the Practice of StatisticsStatisticsISBN:9781319013387Author:David S. Moore, George P. McCabe, Bruce A. CraigPublisher:W. H. Freeman

MATLAB: An Introduction with Applications
Statistics
ISBN:9781119256830
Author:Amos Gilat
Publisher:John Wiley & Sons Inc

Probability and Statistics for Engineering and th...
Statistics
ISBN:9781305251809
Author:Jay L. Devore
Publisher:Cengage Learning

Statistics for The Behavioral Sciences (MindTap C...
Statistics
ISBN:9781305504912
Author:Frederick J Gravetter, Larry B. Wallnau
Publisher:Cengage Learning

Elementary Statistics: Picturing the World (7th E...
Statistics
ISBN:9780134683416
Author:Ron Larson, Betsy Farber
Publisher:PEARSON

The Basic Practice of Statistics
Statistics
ISBN:9781319042578
Author:David S. Moore, William I. Notz, Michael A. Fligner
Publisher:W. H. Freeman

Introduction to the Practice of Statistics
Statistics
ISBN:9781319013387
Author:David S. Moore, George P. McCabe, Bruce A. Craig
Publisher:W. H. Freeman