
MATLAB: An Introduction with Applications
6th Edition
ISBN: 9781119256830
Author: Amos Gilat
Publisher: John Wiley & Sons Inc
expand_more
expand_more
format_list_bulleted
Related questions
Question
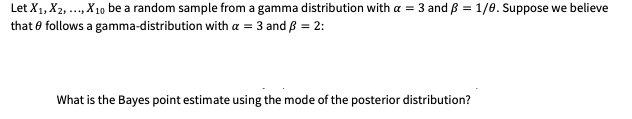

Transcribed Image Text:Let X1, X2, ..., X10 be a random sample from a gamma distribution with a = 3 and B = 1/0. Suppose we believe
that e follows a gamma-distribution with a = 3 and B = 2:
What is the Bayes point estimate using the mode of the posterior distribution?
Expert Solution
This question has been solved!
Explore an expertly crafted, step-by-step solution for a thorough understanding of key concepts.

Step by stepSolved in 2 steps with 2 images

Knowledge Booster

Similar questions
- An ecologist is studying the impact of local polluted waters on the growth of alligators. The length of adult male alligators typically follows a normal distribution with a standard deviation of 2 feet. The ecologist wants to estimate the mean length of this population of alligators. Suppose she samples n alligators at random and uses the sample mean, X to as an estimator for u. a. What is the bias and variance of the estimator? (Note, these may be a function of n.) b. If n = 4, what is the probability that the estimator is within one foot of the true mean? (I.e. find P(|X – µ| < 1). c. What sample size, n, is required for the estimator to be within one foot of the true mean with 95% probability? (I.e. find the value of n that satisfies P(|X – µ| < 1) = 0.95.) d. Suppose the ecologist ends up sampling n = 9 alligators and calculates a sample mean of ī = 10.4 feet. Construct a 95% confidence interval for the population mean. e. Give an interpretation for the interval obtained in (d).arrow_forwardEx. Derive the MLE for a random sample from Exp(A) distribution that is subject to left truncation and right-censoring (LTRC); be sure to provide its variance estimate as well. Compare to the case where there is only right-censoring that we derived in the lecture notes earlier.arrow_forwardReferring to the example below If a compliance rate of 95% is expected how many of the 750 charts requested could fall below the standard and still be within the 95% goal An him department has 50,000 active records on file the record supervisor has established a maximum 15 minute time. For retrieval of a record during the past month 750 charts were requested of this number 688 where retrieved within a 15 minute. What percentage of the records fell below the established standard subtracting 688 from 750 indicates that 62 charts did not meet the required standard bus 62 out of 750 retrievals were not in compliance for an 8.27% non-compliance ratearrow_forward
- The manufacturer of a new eye cream claims that the cream reduces the appearance of fine lines and wrinkles after just 14 days of application. To test the claim, 10 women are randomly selected to participate in a study. The number of fine lines and wrinkles that are visible around each participants eyes is recorded before and after the 14 days of treatment. The following table displays the results. Test the claim at the 0.02 level of significance assuming that the population distribution of the paired differences is approximately normal. Let women before the treatment be Population 2. Before: 10, 11, 14, 11, 9, 11, 12, 14, 11, 14 After: 8, 11, 13 , 11, 5, 7, 13, 12, 8, 10 Question 1 : Compute the value of the test statistic. Round your answer to three decimal places. Additionally Question 2: Draw a conclusion and interpret the decision.arrow_forwardPlease do a, e, and f onlyarrow_forwardLet x be a random variable representing dividend yield of Australian bank stocks. We may assume that x has a normal distribution with s.d.= 2.3% . A random sample of 12 Australian bank stocks has a sample mean of x=6.16% . For the entire Australian stock market, the mean dividend yield is 7.2%. Do these data indicate that the dividend yield of all Australian bank stocks is higher than 7.2%? Find (or estimate) the P-value. Round your answer to three decimal places.arrow_forward
- The results of a state mathematics test for random samples of students taught by two different teachers at the same school are shown below. Can you conclude there is a difference in the mean mathematics test scores for the students of the two teachers? Use α = 0.01. In addition, assume the populations are normally distributed and the population variances/standard deviations are not equal. Teacher 1 Teacher 2 ?̅1 = 473 ?̅2 = 459 S1 = 39.7 S2 = 24.5 n 1 = 8 n 2 = 18 a. State the null and alternate hypotheses (write it mathematically) and write your claim. b. Find the test statistic c. Identify the Rejection region (critical region) and fail to reject region. Show this by drawing a curve and…arrow_forwardSuppose you are constructing a CI for a mean using T distribution and your sample size is 33. What would tge degree of freedom be for the t distribution that you would be usingarrow_forwardThe human resources department of a major corporation announced that the number of people interviewed by the corporation in one month has a mean of 101 and a variance, oʻ, of 266. The management of the corporation suspects that the variance exceeds 266. A random sample of 10 months yielded a mean of 105 interviews, with a variance of 378. If we assume that the number of people interviewed by the corporation in one month follows an approximately normal distribution, is there enough evidence to conclude, at the 0.1 level of significance, that the management's claim is correct? Perform a one-tailed test. Then complete the parts below. Carry your intermediate computations to three or more decimal places and round your answers as specified below. (If necessary, consult a list of formulas.) (a) State the null hypothesis H, and the alternative hypothesis H,. p H. :0 H, :0 (b) Determine the type of test statistic to use. (Choose one) ▼ O=0 OSO (c) Find the value of the test statistic. (Round…arrow_forward
arrow_back_ios
arrow_forward_ios
Recommended textbooks for you
- MATLAB: An Introduction with ApplicationsStatisticsISBN:9781119256830Author:Amos GilatPublisher:John Wiley & Sons Inc
 Probability and Statistics for Engineering and th...StatisticsISBN:9781305251809Author:Jay L. DevorePublisher:Cengage Learning
 Statistics for The Behavioral Sciences (MindTap C...StatisticsISBN:9781305504912Author:Frederick J Gravetter, Larry B. WallnauPublisher:Cengage Learning
  Elementary Statistics: Picturing the World (7th E...StatisticsISBN:9780134683416Author:Ron Larson, Betsy FarberPublisher:PEARSON
 The Basic Practice of StatisticsStatisticsISBN:9781319042578Author:David S. Moore, William I. Notz, Michael A. FlignerPublisher:W. H. Freeman
 Introduction to the Practice of StatisticsStatisticsISBN:9781319013387Author:David S. Moore, George P. McCabe, Bruce A. CraigPublisher:W. H. Freeman
MATLAB: An Introduction with Applications
Statistics
ISBN:9781119256830
Author:Amos Gilat
Publisher:John Wiley & Sons Inc
Probability and Statistics for Engineering and th...
Statistics
ISBN:9781305251809
Author:Jay L. Devore
Publisher:Cengage Learning
Statistics for The Behavioral Sciences (MindTap C...
Statistics
ISBN:9781305504912
Author:Frederick J Gravetter, Larry B. Wallnau
Publisher:Cengage Learning
Elementary Statistics: Picturing the World (7th E...
Statistics
ISBN:9780134683416
Author:Ron Larson, Betsy Farber
Publisher:PEARSON
The Basic Practice of Statistics
Statistics
ISBN:9781319042578
Author:David S. Moore, William I. Notz, Michael A. Fligner
Publisher:W. H. Freeman
Introduction to the Practice of Statistics
Statistics
ISBN:9781319013387
Author:David S. Moore, George P. McCabe, Bruce A. Craig
Publisher:W. H. Freeman