
MATLAB: An Introduction with Applications
6th Edition
ISBN: 9781119256830
Author: Amos Gilat
Publisher: John Wiley & Sons Inc
expand_more
expand_more
format_list_bulleted
Related questions
Concept explainers
Topic Video
Question
My data sets were given picture which I sent
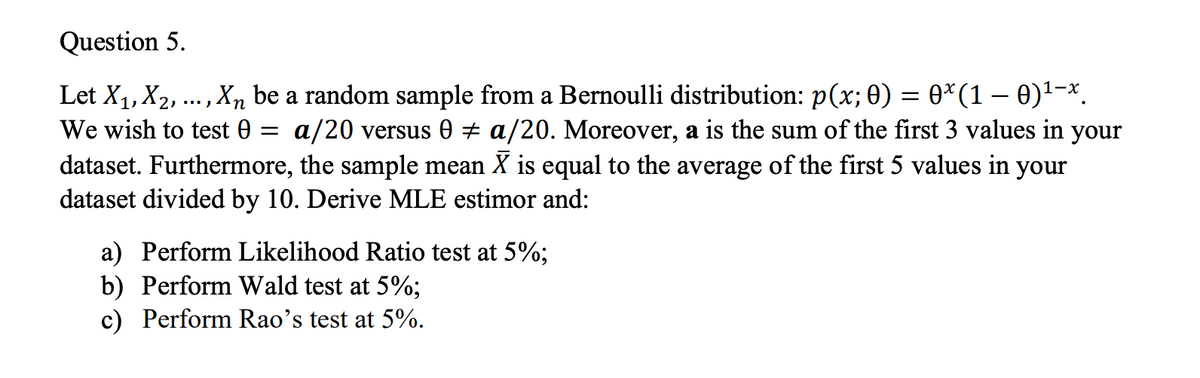

Transcribed Image Text:Question 5.
Let X1, X2, …,
Xn be a random sample from a Bernoulli distribution: p(x; 0) = 0*(1 – 0)1-x.
We wish to test 0 = a/20 versus 0 + a/20. Moreover, a is the sum of the first 3 values in your
dataset. Furthermore, the sample mean X is equal to the average of the first 5 values in your
dataset divided by 10. Derive MLE estimor and:
a) Perform Likelihood Ratio test at 5%;
b) Perform Wald test at 5%;
c) Perform Rao's test at 5%.
![[65747668 4 2676234674 664 664 85 6 4 6]](https://content.bartleby.com/qna-images/question/e8165b54-1e9b-4b79-aa5b-d063ee0876a3/ba89fbb5-3b6b-4cbc-ba59-0e00b9cc61bd/itamrwy_processed.png)
Transcribed Image Text:[65747668 4 2676234674 664 664 85 6 4 6]
Expert Solution
This question has been solved!
Explore an expertly crafted, step-by-step solution for a thorough understanding of key concepts.

This is a popular solution

Trending nowThis is a popular solution!

Step by stepSolved in 4 steps with 2 images

Knowledge Booster


Learn more about
Need a deep-dive on the concept behind this application? Look no further. Learn more about this topic, statistics and related others by exploring similar questions and additional content below.Similar questions
- Could you please answer number 3 and number 4?arrow_forwardThe whole data set will be in the two picturesarrow_forwardThe following list gives the number of public libraries in each of 8 cities. 8, 8, 11, 7, 10, 7, 9, 9 Find the modes of this data set. If there is more than one mode, write them separated by commas. If there is no mode, click on "No mode."arrow_forward
- We asked 32 Learners in Mr. Magana’s Class if they have Facebook. 11 males and 7 females answered yes. 8 females answered no. Build a two-way table that shows this data. Fill in any empty spacesarrow_forwardA researcher is interested in the affects that a person’s avatar (i.e. visual representation of oneself) has on the number of profile views on Facebook.com. The average number of individual personal profile views is known to be 230 views per day (excluding bands, artists, etc.). The researcher creates 36 fictitious profiles that contain roughly the same information but the picture (avatar) is an animated .gif of a smiling face (36 faces randomly selected from a compilation of faces judged to be of average attractiveness). The results showed that of the 36 profiles the average number of views was 250 with a standard deviation of 60. Test the hypothesis that the average number of views for a smiling face gif is significantly different than the usual number of personal profile views.arrow_forwardThe scores of a test for an engineering class of 30 students are shown here. (Due to the nature of this problem, do not use rounded intermediate values in your calculations-including answers submitted in WebAssign.) Scores: 81, 54, 55, 56, 96, 86, 98, 61, 90, 52, 92, 76, 66, 84, 79, 70, 71, 88, 62, 74, 53, 65, 55, 78, 79, 58, 60, 72, 51,80 (a) Determine the frequency (f), midpoint (x), and xf for each range and fill in the table below. (First, organize the scores into the following ranges: 50-59, 60-69, 70-79, 80-89, and 90-99.) (b) Using the following equation, determine the mean value (x) and fill in the table below. Σ(XA) n X = (c) Calculate (x − x) for each range and fill in the table below. (d) Calculate (x - x)²f for each range and fill in the table below. Range Frequency f Midpoint x 50-59 60-69 70-79 80-89 90-99 S = Enter a number. S = (e) Using the following equation, compute the standard deviation of the class scores. Σ(x-x) ²f n - 1 Σ(x-x) ²4 n - 1 = xf 29 X X - X (x - x)²farrow_forward
- There are 10 males and 18 females in the Data Management class. How many different committees of 5 students can be formed if there must be at least 2 males?arrow_forwardhttps://mediaplayer.pearsoncmg.com/assets/APS10_sl_1202?clip=8 Video it links.arrow_forwardYou are given the following set of observations: 41, 29, 38, 19, 22, 34, 50, 42, 40, 44. What is the value of the IQR?arrow_forward
- The data below lists states poverty rate, gun deaths per 100,000 people, high school graduation rate and the unemployment rate. Use a 2x2 contingency table for questions 1-3. Use the median to divide each list into 2 groups. 1) Test for independence between poverty rate and gun deaths. 2) Test for independence between high school graduation rate and gun deaths. 3) Test for independence between unemployment and gun deaths. 4) Divide the data into 3 groups by gun deaths: 0-9, 9.1-12 and 12.1-20. Use ANOVA to test the claim that the average poverty rate is the same for the three groups. Be sure to write down the mean and standard deviation for each group. 0-9 9.1-12 12.1-20 n = x = s = n = x = s = n = x = s =arrow_forwardWe are interested in estimating the proportion of people that can identify Nebraska but not Vermont. In a class of 55 students, each student was requested to select a sample of 6 people, show each person a map of the US and ask the person to identify the states of Vermont and Nebraska. The following numbers are the counts that each student got, that is, each number is the count of people in the student sample of 6, that could identify Nebraska but not Vermont.3344010110020030002020001100002010000001000200000001010Note: You can cut and past these numbers into an excel spreadsheet to help you calculate the mean and the standard deviation and compute the confidence interval. If you have trouble pasting them, paste them to a text file first and then copy from there.When we collect all the students' data, we have a sample size of 6x55=330.Of the sample of 330 people, what proportion were able to locate Nebraska but not Vermont? (round answer to 3 decimals) Find a 95% confidence interval for…arrow_forwardPeople living in a certain area have observed 102 rainy days in the year 2018, 96 rainy days in 2019, 111 rainy days in 2020. Use the best fit line to predict, how many rainy days they will see in 2021.arrow_forward
arrow_back_ios
SEE MORE QUESTIONS
arrow_forward_ios
Recommended textbooks for you
- MATLAB: An Introduction with ApplicationsStatisticsISBN:9781119256830Author:Amos GilatPublisher:John Wiley & Sons Inc
 Probability and Statistics for Engineering and th...StatisticsISBN:9781305251809Author:Jay L. DevorePublisher:Cengage Learning
 Statistics for The Behavioral Sciences (MindTap C...StatisticsISBN:9781305504912Author:Frederick J Gravetter, Larry B. WallnauPublisher:Cengage Learning
  Elementary Statistics: Picturing the World (7th E...StatisticsISBN:9780134683416Author:Ron Larson, Betsy FarberPublisher:PEARSON
 The Basic Practice of StatisticsStatisticsISBN:9781319042578Author:David S. Moore, William I. Notz, Michael A. FlignerPublisher:W. H. Freeman
 Introduction to the Practice of StatisticsStatisticsISBN:9781319013387Author:David S. Moore, George P. McCabe, Bruce A. CraigPublisher:W. H. Freeman
MATLAB: An Introduction with Applications
Statistics
ISBN:9781119256830
Author:Amos Gilat
Publisher:John Wiley & Sons Inc
Probability and Statistics for Engineering and th...
Statistics
ISBN:9781305251809
Author:Jay L. Devore
Publisher:Cengage Learning
Statistics for The Behavioral Sciences (MindTap C...
Statistics
ISBN:9781305504912
Author:Frederick J Gravetter, Larry B. Wallnau
Publisher:Cengage Learning
Elementary Statistics: Picturing the World (7th E...
Statistics
ISBN:9780134683416
Author:Ron Larson, Betsy Farber
Publisher:PEARSON
The Basic Practice of Statistics
Statistics
ISBN:9781319042578
Author:David S. Moore, William I. Notz, Michael A. Fligner
Publisher:W. H. Freeman
Introduction to the Practice of Statistics
Statistics
ISBN:9781319013387
Author:David S. Moore, George P. McCabe, Bruce A. Craig
Publisher:W. H. Freeman