MATLAB: An Introduction with Applications
6th Edition
ISBN: 9781119256830
Author: Amos Gilat
Publisher: John Wiley & Sons Inc
expand_more
expand_more
format_list_bulleted
Concept explainers
Question
The final question in the examples is
(e) Find the value of the coefficient of determination r2. What percentage of the variation in y can be explained by the corresponding variation in x and the least-squares line? What percentage is unexplained? (Round your answer for r2 to three decimal places. Round your answers for the percentages to one decimal place.)
|
r2 = |
|
|
explained |
% |
|
unexplained |
% |
(f) Predict the percentage of all fatal accidents due to speeding for 25-year-olds. (Round your answer to two decimal places.)


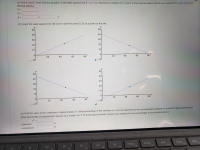
Transcribed Image Text:Let x be the age in years of a licensed automobile driver. Let y be the percentage of all fatal accidents (for a given age) due to speeding. For example, the first data pair indicates that
37% of all fatal accidents of 17-year-olds are due to.speeding.
17
27
37
47
57
67
77
37
23
23
12
10
7
Complete parts (a) through (e), given Ex = 329, Ey = 117, Ex² = 18,263, Ey2 = 2745, Exy = 4089, and r -0.948.
(a) Draw a scatter diagram displaying the data.
Expert Solution
This question has been solved!
Explore an expertly crafted, step-by-step solution for a thorough understanding of key concepts.
This is a popular solution
Trending nowThis is a popular solution!
Step by stepSolved in 3 steps with 6 images

Knowledge Booster
Learn more about
Need a deep-dive on the concept behind this application? Look no further. Learn more about this topic, statistics and related others by exploring similar questions and additional content below.Similar questions
- Can you please help with 4.30 sulfur, the ocean and the sun? Only part A which is make a scatter plot that shows how DMS responds to SRD.arrow_forwardUse the value of the linear correlation coefficient to calculate the coefficient of determination. What does this tell you about the explained variation of the data about the regression line? About the unexplained variation? r= - 0.884 Calculate the coefficient of determination. (Round to three decimal places as needed.)arrow_forwardPlease help it’s not gradedarrow_forward
- The percentage of the variation in the value of y this is explained by the lease squares regression line is Group of answer choices ρ the slope of the regression line. the correlation coefficient. the coefficient of determination. the y-intercept of the regression line. The data below shows the summary statistics for a regression analysis on car weight (in metric tons) and fuel consumption (in miles per gallon). b0=48.8b0=48.8 b1=−8.37b1=−8.37 r2=0.36r2=0.36 (Note that 0.362=0.13 and 0.36−−−−√=0.6)(Note that 0.362=0.13 and 0.36=0.6) Choose the correct interpretation of the y-intercept of the line:arrow_forwardr = -0.579 Calculate the coefficient of determination. (Round to three decimal places as needed.) What does this tell you about the explained variation of the data about the regression line? % of the variation can be explained by the regression line. (Round to one decimal place as needed.) About the unexplained variation? % of the variation is unexplained and is due to other factors or to sampling error. (Round to one decimal place as needed.)arrow_forwardegression line? About the unexplained variation? r= -0 422 Calculate the coefficient of determination. Round to three decimal places as needed.) What does this tell you about the explained variation of the data about the regression line? % of the variation can be explained by the regression line. (Round to one decimal place as needed.) About the unexplained variation? % of the variation is unexplained and is due to other factors or to sampling error. (Round to one decimal place as needed.)arrow_forward
- Why is the coefficient of variation important? What do we mean when we say that the coefficient of variation has no units? What advantage can there be in having no units? Why is relative size important?arrow_forwardUse the value of the linear correlation coefficient to calculate the coefficient of determination. What does this tell you about the explained variation of the data about the regression line? About the unexplained variation? r= -0.438 please dont copy paste the content from other sitesarrow_forwardCan you please help with sub-parts C and Darrow_forward
- Please help!!arrow_forwardUsing your favorite statistics software package, you generate a scatter plot with a regression equation and correlation coefficient. The regression equation is reported asy=−62.75x+42.07y=-62.75x+42.07and the r=−0.022r=-0.022.What proportion of the variation in y can be explained by the variation in the values of x?r² = %Report answer as a percentage accurate to one decimal place.arrow_forward
arrow_back_ios
arrow_forward_ios
Recommended textbooks for you
 MATLAB: An Introduction with ApplicationsStatisticsISBN:9781119256830Author:Amos GilatPublisher:John Wiley & Sons Inc
 Probability and Statistics for Engineering and th...StatisticsISBN:9781305251809Author:Jay L. DevorePublisher:Cengage Learning
 Statistics for The Behavioral Sciences (MindTap C...StatisticsISBN:9781305504912Author:Frederick J Gravetter, Larry B. WallnauPublisher:Cengage Learning
 Elementary Statistics: Picturing the World (7th E...StatisticsISBN:9780134683416Author:Ron Larson, Betsy FarberPublisher:PEARSON
 The Basic Practice of StatisticsStatisticsISBN:9781319042578Author:David S. Moore, William I. Notz, Michael A. FlignerPublisher:W. H. Freeman
 Introduction to the Practice of StatisticsStatisticsISBN:9781319013387Author:David S. Moore, George P. McCabe, Bruce A. CraigPublisher:W. H. Freeman

MATLAB: An Introduction with Applications
Statistics
ISBN:9781119256830
Author:Amos Gilat
Publisher:John Wiley & Sons Inc

Probability and Statistics for Engineering and th...
Statistics
ISBN:9781305251809
Author:Jay L. Devore
Publisher:Cengage Learning

Statistics for The Behavioral Sciences (MindTap C...
Statistics
ISBN:9781305504912
Author:Frederick J Gravetter, Larry B. Wallnau
Publisher:Cengage Learning

Elementary Statistics: Picturing the World (7th E...
Statistics
ISBN:9780134683416
Author:Ron Larson, Betsy Farber
Publisher:PEARSON

The Basic Practice of Statistics
Statistics
ISBN:9781319042578
Author:David S. Moore, William I. Notz, Michael A. Fligner
Publisher:W. H. Freeman

Introduction to the Practice of Statistics
Statistics
ISBN:9781319013387
Author:David S. Moore, George P. McCabe, Bruce A. Craig
Publisher:W. H. Freeman