
MATLAB: An Introduction with Applications
6th Edition
ISBN: 9781119256830
Author: Amos Gilat
Publisher: John Wiley & Sons Inc
expand_more
expand_more
format_list_bulleted
Related questions
Question
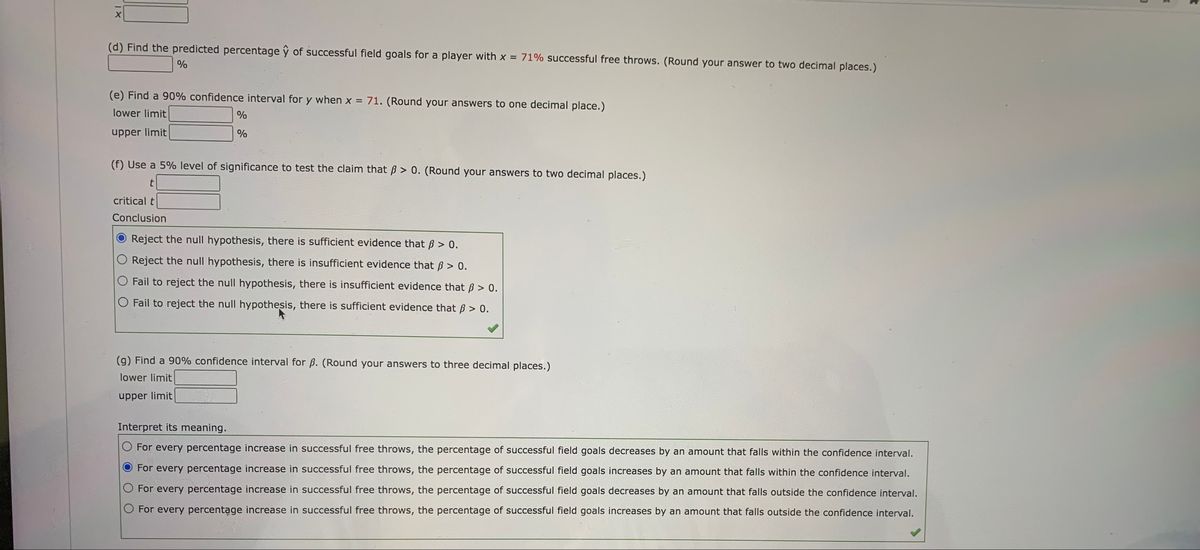

Transcribed Image Text:(d) Find the predicted percentage ŷ of successful field goals for a player with x = 71% successful free throws. (Round your answer to two decimal places.)
%
(e) Find a 90% confidence interval for y when x = 71. (Round your answers to one decimal place.)
%3!
lower limit
upper limit
(f) Use a 5% level of significance to test the claim that B > 0. (Round your answers to two decimal places.)
t
critical t
Conclusion
Reject the null hypothesis, there is sufficient evidence that B > 0.
O Reject the null hypothesis, there is insufficient evidence that ß > 0.
O Fail to reject the null hypothesis, there is insufficient evidence that B > 0.
O Fail to reject the null hypothesis, there is sufficient evidence that ß > 0.
(g) Find a 90% confidence interval for ß. (Round your answers to three decimal places.)
lower limit
upper limit
Interpret its meaning.
O For every percentage increase in successful free throws, the percentage of successful field goals decreases by an amount that falls within the confidence interval.
For every percentage increase in successful free throws, the percentage of successful field goals increases by an amount that falls within the confidence interval.
O For every percentage increase in successful free throws, the percentage of successful field goals decreases by an amount that falls outside the confidence interval.
O For every percentage increase in successful free throws, the percentage of successful field goals increases by an amount that falls outside the confidence interval.

Transcribed Image Text:Let x be a random variable that represents the percentage of successful free throws a professional basketball player makes in a season. Let y be a random variable that represents the percentage of successful field goals a professional
basketball player makes in a season. A random sample of n =
6 professional basketball players gave the following information.
67
64
75
86
73
73
44
41
48
51
44
51
(a) Verify that Ex = 438, Ey = 279, Ex = 32264, Ey = 13059, Exy = 20493, and r 0.800.
Σχ
%3D
Ey
Ex²
Ey2
Σχy
r
(b) Use a 5% level of significance to test the claim that p > 0. (Round your answers to two decimal places.)
critical t
Conclusion
Reject the null hypothesis, there is sufficient evidence that p > 0.
Reject the null hypothesis, there is insufficient evidence that p > 0.
Fail to reject the null hypothesis, there is insufficient evidence that p > 0.
O Fail to reject the null hypothesis, there is sufficient evidence that p > 0.
(c) Verify that S 2.7729, a - 14.783, b 0.4345, and x 73.000.
S.
e
a
(d) Find the predicted percentage ŷ of successful field goals for a player with x = 71% successful free throws. (Round your answer to two decimal places.)
(e) Find a 90% confidence interval for y when x = 71. (Round your answers to one decimal place.)
lower limit
%
upper limit
%
(f) Use a 5% level of significance to test the claim that ß > 0. (Round your answers to two decimal places.)
critical t
Conclusion
A1X
Expert Solution
This question has been solved!
Explore an expertly crafted, step-by-step solution for a thorough understanding of key concepts.

Step by stepSolved in 2 steps with 3 images

Knowledge Booster

Similar questions
- MAKE SURE YOU SELECT 2 ANSWERS FOR THIS QUESTION - Type of test and hypothesis. Professor Diff E. Cult wonders if male and female students earn significantly different grades when taking the same course with the same instructor. He randomly samples 160 males and 100 females from selected classes. The males receive 20 As, 32 Bs, 70 Cs, 30 Ds, and 8 Fs. The females receive 20 As, 28 Bs, 30 Cs, 10 Ds, and 12 Fs. His hypothesis is that gender and grades are related. Choose the type of test you should use to test this hypothesis? Then choose the correct hypotheses in symbol notation (or words if symbol is not appropriate). O z-test single sample t-test dependent t-test O independent t-test Pearson correlation t-test ANOVA O Chi-Square Goodness of Fit Test Chi-Square Test of Independence O Ho: H1 - P2 = 0 H1: P1 - P2 # 0 O Ho: µ1 - P2 < 0arrow_forwardA physical therapist wanted to know whether the mean step pulse of men was less than the mean step pulse of women. She randomly selected 54 men and 70 women to participate in the study. Each subject was required to step up and down a 6-inch platform. The pulse of each subject was then recorded. The following results were obtained. Two sample T for Men vs Women N Mean StDev SE Mean Men Women 98% CI for mu Men - mu Women (- 12.20, - 1.00) T-Test mu Men = mu Women (vs H2 O C. Ho: H1 = H2; Ha: H1 #H2 (b) Identify the P-value and state the researcher's conclusion if the level of significance was a = 0.01. What is the P-value? P-value =arrow_forwardThe U.S. Geological Survey compiled historical data about Old Faithful Geyser (Yellowstone National Park) from 1870 to 1987. Let x1 be a random variable that represents the time interval (in minutes) between Old Faithful eruptions for the years 1948 to 1952. Based on 9180 observations, the sample mean interval was x1 = 62.6 minutes. Let x2 be a random variable that represents the time interval in minutes between Old Faithful eruptions for the years 1983 to 1987. Based on 24,872 observations, the sample mean time interval was x2 = 70.0 minutes. Historical data suggest that σ1 = 8.91 minutes and σ2 = 11.78 minutes. Let μ1 be the population mean of x1 and let μ2 be the population mean of x2. (a) Compute a 95% confidence interval for μ1 – μ2. (Use 2 decimal places.) lower limit upper limit (b) Comment on the meaning of the confidence interval in the context of this problem. Does the interval consist of positive numbers only? negative numbers only? a mix of positive and…arrow_forward
- Let x be a random variable that represents the pH of CVS brand water. The mean of this x distribution is µ = 6.5 pH. A new company wants to sell its water at CVS locations. However, CVS management believes that the new brand will have a mean pH less than the CVS brand water. A random sample of 50 water samples were taken from this new company's water and it was found that the sample mean was 6.3 pH and the sample standard deviation was s = 0.5 pH. Do the data indicate that the new company's water has a mean pH level less than 6.5, which is the pH of the CVS brand water. Use a 5% significance level. Identify the following in your answer. 1. Identify the null Ho and alternative hypotheses H1 for the problem. 2. Identify the following: Sample statistic • Test Statistic (t): (Round to three decimal places) p - value: (Round to four places) • Calculator key used. 3. Identify the significance level and determine if you reject or fail to reject the null hypothesis. 4. State your conclusion.arrow_forwardA psychologist found a study which claiming that 32% of patients who visit a psychologist have symptoms of anxiety. This psychologist had 44 patients visit. Let x = the number of patients that had symptoms of anxiety. (a) The random variable is which of the following? O the number of psychologists O the number of patients who visited the psychologist the number of patients who had symptoms of anxiety O the number of patients without symptoms of anxiety (b) How many total patients did the psychologist have visit?arrow_forwardMagnetic surveying is one technique used by archaeologists to determine anomalies arising from variations in magnetic susceptibility. Unusual changes in magnetic susceptibility might (or might not) indicate an important archaeological discovery. Let x be a random variable that represents a magnetic susceptibility (MS) reading for a randomly chosen site at an archaeological research location. A random sample of 120 sites gave the readings shown in the table below. Magnetic Susceptibility Readings, -6 centimeter-gram-second x 10 Magnetic (cmg x 10-6) Number of Estimated Susceptibility 0 5 and nq > 5 are both satisfied. Yes, it is appropriate since n 2 30. O Yes, it is appropriate since the criterian > 100 and np 5 and nq > 5 are not satisfied.arrow_forward
- Dandelions have effects on crop production and lawn growth and are studied. In one region, the mean number of dandelions per square meter was found to be 10.8.Find the probability of no dandelions in an area of 1 m².P(X=0)=P(X=0)= Find the probability of at least one dandelion in an area of 1 m².P(at least one) = Find the probability of at most two dandelions in an area of 1 m².P(X≤2)=P(X≤2)=arrow_forwardAssume that a high school principal believes that high number of absences hinders the students' ability to perform on standardized tests. He randomly selects a sample of 9 students who had 5 or more absences in the school year. The average ACT Composite score for this sample is X = 19 with s = 4.9. ACT Composite scores are normally distributed with u = 21.0. Do the data support the claim that the high number of absences hinders the students' ability to perform on standardized tests, using a = .05? Please show the four-step hypothesis test. %3Darrow_forwardThe U.S. Geological Survey compiled historical data about Old Faithful Geyser (Yellowstone National Park) from 1870 to 1987. Let x1 be a random variable that represents the time interval (in minutes) between Old Faithful eruptions for the years 1948 to 1952. Based on 9520 observations, the sample mean interval was x1 = 62.8 minutes. Let x2 be a random variable that represents the time interval in minutes between Old Faithful eruptions for the years 1983 to 1987. Based on 23,117 observations, the sample mean time interval was x2 = 73.0 minutes. Historical data suggest that ?1 = 8.98 minutes and ?2 = 12.83 minutes. Let ?1 be the population mean of x1 and let ?2 be the population mean of x2. (a) Compute a 90% confidence interval for ?1 – ?2. (Use 2 decimal places.) lower limit upper limit (b) Comment on the meaning of the confidence interval in the context of this problem. Does the interval consist of positive numbers only? negative numbers only? a mix of positive and…arrow_forward
arrow_back_ios
arrow_forward_ios
Recommended textbooks for you
- MATLAB: An Introduction with ApplicationsStatisticsISBN:9781119256830Author:Amos GilatPublisher:John Wiley & Sons Inc
 Probability and Statistics for Engineering and th...StatisticsISBN:9781305251809Author:Jay L. DevorePublisher:Cengage Learning
 Statistics for The Behavioral Sciences (MindTap C...StatisticsISBN:9781305504912Author:Frederick J Gravetter, Larry B. WallnauPublisher:Cengage Learning
  Elementary Statistics: Picturing the World (7th E...StatisticsISBN:9780134683416Author:Ron Larson, Betsy FarberPublisher:PEARSON
 The Basic Practice of StatisticsStatisticsISBN:9781319042578Author:David S. Moore, William I. Notz, Michael A. FlignerPublisher:W. H. Freeman
 Introduction to the Practice of StatisticsStatisticsISBN:9781319013387Author:David S. Moore, George P. McCabe, Bruce A. CraigPublisher:W. H. Freeman
MATLAB: An Introduction with Applications
Statistics
ISBN:9781119256830
Author:Amos Gilat
Publisher:John Wiley & Sons Inc
Probability and Statistics for Engineering and th...
Statistics
ISBN:9781305251809
Author:Jay L. Devore
Publisher:Cengage Learning
Statistics for The Behavioral Sciences (MindTap C...
Statistics
ISBN:9781305504912
Author:Frederick J Gravetter, Larry B. Wallnau
Publisher:Cengage Learning
Elementary Statistics: Picturing the World (7th E...
Statistics
ISBN:9780134683416
Author:Ron Larson, Betsy Farber
Publisher:PEARSON
The Basic Practice of Statistics
Statistics
ISBN:9781319042578
Author:David S. Moore, William I. Notz, Michael A. Fligner
Publisher:W. H. Freeman
Introduction to the Practice of Statistics
Statistics
ISBN:9781319013387
Author:David S. Moore, George P. McCabe, Bruce A. Craig
Publisher:W. H. Freeman