MATLAB: An Introduction with Applications
6th Edition
ISBN: 9781119256830
Author: Amos Gilat
Publisher: John Wiley & Sons Inc
expand_more
expand_more
format_list_bulleted
Question
thumb_up100%

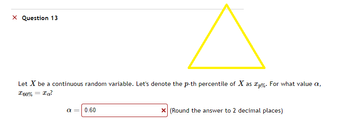
Transcribed Image Text:X Question 13
Let X be a continuous random variable. Let's denote the p-th percentile of X as p%. For what value a,
160% = IQ?
α = 0.60
X (Round the answer to 2 decimal places)
Expert Solution
This question has been solved!
Explore an expertly crafted, step-by-step solution for a thorough understanding of key concepts.
This is a popular solution
Trending nowThis is a popular solution!
Step by stepSolved in 2 steps

Knowledge Booster
Similar questions
- STEP BY STEP DONT USE EXCEL! HW22#14arrow_forwardProb and statarrow_forwardZ = -0.0U 1.40 %3D Z3 -0.80 10. Find the z-score corresponding to a score of X = 45 for each of the following distributions. 40and o a. u = = 20 b. u = 40 and o = %3D 10 %3D C. u = 40 and o = 5 d. u = 40 and o = 2arrow_forward
- 4. As fallen trees lie on the forest floor they slowly decay. Will the amount of light present have an impact on the rate of decay? In the following table x is a random variable representing the remaining percentage of total mass of a log after it was exposed to the elements for three weeks while y represents the numbers of hours of direct sunlight the log received each day. X 0.60 .70 .65 .82 .87 y 1.0 2.3 3.0 4.0 4.5 (a) Plot a scatter diagram of the data. Remember to label your axes appropriately and choose a consistent scale. (b) Based on a scatter diagram, would you estimate the correlation coefficient to be positive, close to zero, or negative? Please circle one of the following choices: A. Positive B. Close to zero C. Negative (c) Interpret your results from parts (a) and (b). 16 tvarrow_forwardLet x be a random variable that represents red blood cell count (RBC) in millions of cells per cubic millimeter of whole blood. Then x has a distribution that is approximately normal, For the population of healthy female adults, suppose the mean of the x distribution is about 4.64, Suppose that a female patient has taken six laboratory blod tests over the past several months and that the RBC count data sent to the patient's doctor are as follows. 4.9 4.2 4.5 4.1 4.4 4.3 () Use a calculator with sample mean and standard deviation keys to find x and s. (Round your answers to two decimal places.) C) Do the given data indicate that the pooulation mean RBC count for this patient is lower than 4.647 Use a- 0.05. (a) What is the level of significance? State the nul and alternate hypotheses. O Hn: 4- 4.64; H: 4.64 O Ho: H> 4.64; H:u- 4.64 O Hn: H- 4.64; H: H 4.64 (b) What sampling distribution will you use? Explain the rationale for your choice of sampling distribution. O The standard normal,…arrow_forwardnN(dp) is define as the “number distribution function” , where dp is the particle diameter. Assume nN(dp) is a normal distribution with a mean of 10 µm and a standard deviation of 2 µm. The total number concentration of particles of all sizes is 10,000 particles cm-3. What is the number concentration of particles in the size range 10 µm and 14 µm?arrow_forward
arrow_back_ios
arrow_forward_ios
Recommended textbooks for you
 MATLAB: An Introduction with ApplicationsStatisticsISBN:9781119256830Author:Amos GilatPublisher:John Wiley & Sons Inc
 Probability and Statistics for Engineering and th...StatisticsISBN:9781305251809Author:Jay L. DevorePublisher:Cengage Learning
 Statistics for The Behavioral Sciences (MindTap C...StatisticsISBN:9781305504912Author:Frederick J Gravetter, Larry B. WallnauPublisher:Cengage Learning
 Elementary Statistics: Picturing the World (7th E...StatisticsISBN:9780134683416Author:Ron Larson, Betsy FarberPublisher:PEARSON
 The Basic Practice of StatisticsStatisticsISBN:9781319042578Author:David S. Moore, William I. Notz, Michael A. FlignerPublisher:W. H. Freeman
 Introduction to the Practice of StatisticsStatisticsISBN:9781319013387Author:David S. Moore, George P. McCabe, Bruce A. CraigPublisher:W. H. Freeman

MATLAB: An Introduction with Applications
Statistics
ISBN:9781119256830
Author:Amos Gilat
Publisher:John Wiley & Sons Inc

Probability and Statistics for Engineering and th...
Statistics
ISBN:9781305251809
Author:Jay L. Devore
Publisher:Cengage Learning

Statistics for The Behavioral Sciences (MindTap C...
Statistics
ISBN:9781305504912
Author:Frederick J Gravetter, Larry B. Wallnau
Publisher:Cengage Learning

Elementary Statistics: Picturing the World (7th E...
Statistics
ISBN:9780134683416
Author:Ron Larson, Betsy Farber
Publisher:PEARSON

The Basic Practice of Statistics
Statistics
ISBN:9781319042578
Author:David S. Moore, William I. Notz, Michael A. Fligner
Publisher:W. H. Freeman

Introduction to the Practice of Statistics
Statistics
ISBN:9781319013387
Author:David S. Moore, George P. McCabe, Bruce A. Craig
Publisher:W. H. Freeman