
MATLAB: An Introduction with Applications
6th Edition
ISBN: 9781119256830
Author: Amos Gilat
Publisher: John Wiley & Sons Inc
expand_more
expand_more
format_list_bulleted
Related questions
Concept explainers
Question
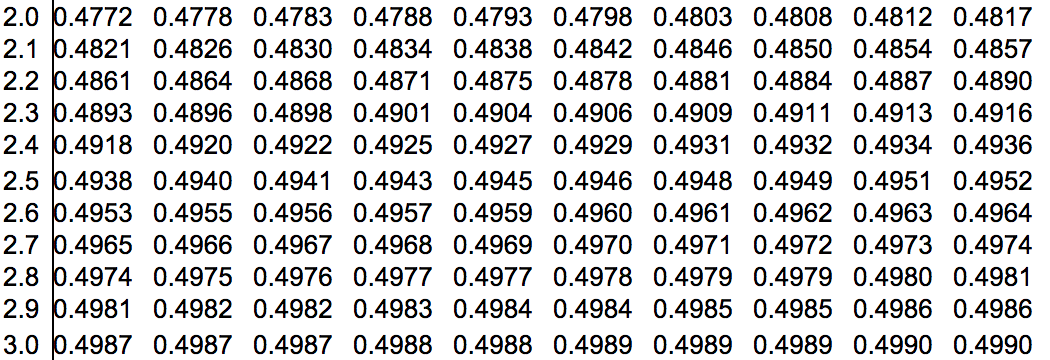
Let x be a continuous random variable with a standard
Use the table attached below
P(−1.71 <= x <= 1.39) =
(round to four decimal places if needed)


Expert Solution
This question has been solved!
Explore an expertly crafted, step-by-step solution for a thorough understanding of key concepts.

This is a popular solution

Trending nowThis is a popular solution!

Step by stepSolved in 2 steps with 1 images

Knowledge Booster


Learn more about
Need a deep-dive on the concept behind this application? Look no further. Learn more about this topic, statistics and related others by exploring similar questions and additional content below.Similar questions
- Please use the standard normal distribution to find P(- 2.25 < z < 0). Thank youarrow_forwardHayley has 120 apple trees of a certain variety in her orchard. She estimates the population of apples has a mean of 9 seeds per apple with a standard deviation of 2 seeds. The distribution in the number of seeds per apple has a shape that is approximately normal. The table gives the standard normal distribution. z area to left of z score -3 .00135 -2 .02275 -1 .15866 0 .50000 1 .84134 2 .97725 3 .99865 What percent of Hayley's apples have between 5 and 11 seeds? rounded to the tenths place. Approximately (blank)% of Hayley's apples have between 5 and 11 seeds.arrow_forwardLet z be a random variable with a standard normal distribution. Find the indicated probability. (Round your answer to four decimal places.) P(−1.75 ≤ z ≤ −1.27) = Shade the corresponding area under the standard normal curve.arrow_forward
- Central High School believes their students have unusually high SAT scores on average. The school has 165 students.Based on national data, the average SAT score is 1067 with a population standard deviation of 207. Assume SAT scores are normally distributed. Let X be the random variable representing the mean SAT scores for groups of 165 randomly selected students.a. Fill in the blank, rounding your answers to 2 decimal places if needed. According to the Central Limit Theorem, X is approximately normal with a mean of and a standard error of the mean .b. Find the z-score associated to a sample with a mean of 1109, using the sampling distribution. Round your answer to two decimal places. c. Find the probability that a randomly selected sample of 165 students has a mean SAT score higher than 1109. Round your answer to 4 decimal places. d. Central High School finds that for their students, the average SAT score is 1109. Are they justified in saying their students perform unusually well on…arrow_forwardAssume that x has a normal distribution with the specified mean and standard deviation. Find the indicated probability. (Round your answer to four decimal places.) A USE SALT l = 106; o = 13 P(x z 120) =arrow_forwardUse the table of areas under the standard normal curve to find the probability that a z-score from the standard normal distribution will lie within the interval. (Round your answer to four decimal places.) z < 1.3arrow_forward
- Assume that adults have IQ scores that are normally distributed with a mean of μ= 100 and a standard deviation σ = 20. Find the probability that a randomly selected adult has an IQ less than 120. Click to view page 1 of the table. Click to view page 2 of the table. The probability that a randomly selected a (Type an integer or decimal rounded to fo Standard Normal Table (Page 1) NEGATIVE z Scores Standard Normal (z) Distribution: Cumulative Area from the LEFT .00 .01 02 .03 .04 .05 .06 .07 .08 .09 -3.50 and lower .0001 -3.4 .0003 .0003 .0003 .0003 .0003 .0003 .0003 .0003 .0003 0002 -3.3 .0005 .0005 .0005 .0004 .0004 .0004 0004 .0004 0004 .0003 -3.2 .0007 .0007 .0006 .0006 .0006 .0006 0006 .0005 .0005 0005 -31 0010 .0009 .0009 .0009 .0008 .0008 .0008 .0008 .0007 .0007 -3.0 .0013 0013 .0013 0012 .0012 .0011 .0011 .0011 0010 0010 -2.9 .0019 .0018 0018 .0017 .0016 .0016 0015 .0015 .0014 .0014 -2.8 .0026 .0025 .0024 .0023 .0023 .0022 .0021 .0021 .0020 0019 -2.7 .0035 .0034 .0033 .0032 .0031…arrow_forwardLet z be a random variable with a standard normal distribution. Find the indicated probability. (Round your answer to four decimal places.) P(z ≥ −1.60)= _______________Shade the corresponding area under the standard normal curve.arrow_forwardAn elevator can safely hold 3500 pounds. A sign in the elevator limits the passenger count to 15. If the adult population has a mean weight of 180 pounds with a 25-pound standard deviation, how unusual would it be, if the central limit theorem applied, that an elevator holding 15 people would be carrying more than 3500 pounds? Note. Use pnorm which is the normal distribution function of R.arrow_forward
arrow_back_ios
arrow_forward_ios
Recommended textbooks for you
- MATLAB: An Introduction with ApplicationsStatisticsISBN:9781119256830Author:Amos GilatPublisher:John Wiley & Sons Inc
 Probability and Statistics for Engineering and th...StatisticsISBN:9781305251809Author:Jay L. DevorePublisher:Cengage Learning
 Statistics for The Behavioral Sciences (MindTap C...StatisticsISBN:9781305504912Author:Frederick J Gravetter, Larry B. WallnauPublisher:Cengage Learning
  Elementary Statistics: Picturing the World (7th E...StatisticsISBN:9780134683416Author:Ron Larson, Betsy FarberPublisher:PEARSON
 The Basic Practice of StatisticsStatisticsISBN:9781319042578Author:David S. Moore, William I. Notz, Michael A. FlignerPublisher:W. H. Freeman
 Introduction to the Practice of StatisticsStatisticsISBN:9781319013387Author:David S. Moore, George P. McCabe, Bruce A. CraigPublisher:W. H. Freeman
MATLAB: An Introduction with Applications
Statistics
ISBN:9781119256830
Author:Amos Gilat
Publisher:John Wiley & Sons Inc
Probability and Statistics for Engineering and th...
Statistics
ISBN:9781305251809
Author:Jay L. Devore
Publisher:Cengage Learning
Statistics for The Behavioral Sciences (MindTap C...
Statistics
ISBN:9781305504912
Author:Frederick J Gravetter, Larry B. Wallnau
Publisher:Cengage Learning
Elementary Statistics: Picturing the World (7th E...
Statistics
ISBN:9780134683416
Author:Ron Larson, Betsy Farber
Publisher:PEARSON
The Basic Practice of Statistics
Statistics
ISBN:9781319042578
Author:David S. Moore, William I. Notz, Michael A. Fligner
Publisher:W. H. Freeman
Introduction to the Practice of Statistics
Statistics
ISBN:9781319013387
Author:David S. Moore, George P. McCabe, Bruce A. Craig
Publisher:W. H. Freeman