MATLAB: An Introduction with Applications
6th Edition
ISBN: 9781119256830
Author: Amos Gilat
Publisher: John Wiley & Sons Inc
expand_more
expand_more
format_list_bulleted
Concept explainers
Topic Video
Question

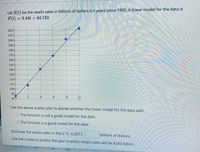
Transcribed Image Text:The following table shows retail sales in drug stores in billions of dollars in the U.S. for years since
1995.
Year
Retail Sales
85.851
3.
108.426
6.
141.781
9.
169.256
12
202.297
15
222.266
Let S(t) be the retails sales in billions of dollars in t years since 1995. A linear model for the data is
F(t) =
= 9.44t + 84.182.

Transcribed Image Text:Let S(t) be the retails sales in billions of dollars in t years since 1995. A linear model for the data is
F(t)
= 9.44t + 84.182.
220-
210
200
190
180
170-
160-
150
140-
130
120
110
100
90
804
3
12
15
Use the above scatter plot to decide whether the linear model fits the data well.
O The function is not a good model for the data
O The function is a good model for the data.
Estimate the retails sales in the U. S. in 2017.
billions of dollars.
Use the model to predict the year in which retails sales will be $243 billion.
Expert Solution
arrow_forward
Step 1
Regression Analysis:
An independent variable is multiplied with a slope and added with an intercept to get the dependent variable is basically known as a regression. The estimation of the dependent variable can a good estimate if the regression model is a good fit model.
In order to know whether the model is a good fit or not, the residual has to be less.
Residual= observed value - predicted value.
e=y-.
Trending nowThis is a popular solution!
Step by stepSolved in 4 steps

Knowledge Booster
Learn more about
Need a deep-dive on the concept behind this application? Look no further. Learn more about this topic, statistics and related others by exploring similar questions and additional content below.Similar questions
- iv, v only please. thank youarrow_forwardThe temperature of a liquid during the first four minutes of an experiment has been recorded in the table below. Time (x) (minutes) 0 1 2 3 4 Temperature (y) (°C) 30 33 40 56 73 Determine if the relationship between temperature and time is linear by constructing a residual plot.arrow_forwardInterpret the graph. Is there a linear relationship between angle of rotation and reaction time? Describe the relationship.arrow_forward
- How much should a healthy Shetland pony weigh? Let x be the age of the pony (in months), and let y be the average weight of the pony (in kilograms). x 3 6 12 20 26 y 60 95 140 160 189 (a) Make a scatter diagram of the data and visualize the line you think best fits the data. Flash Player version 10 or higher is required for this question. You can get Flash Player free from Adobe's website. (b) Would you say the correlation is low, moderate, or strong? low moderate strong Would you say the correlation is positive or negative? positive negative (c) Use a calculator to verify that x = 67, x2 = 1265, y = 644, y2 = 93,546, and xy = 10,544. Compute r. (Round your answer to three decimal places.) As x increases from 3 to 26 months, does the value of r imply that y should tend to increase or decrease? Explain your answer. Given our value of r, y should…arrow_forward800 700 600 500 400 300 200 100 1 2345 67 8 9 10 11 12 13 14 15 16 age Its slope is positive. It passes through the point (0,0). It stops at y = 800. None of the answers is correct.arrow_forwardThis graph displays the distance traveled by a golf cart as a function of time in seconds. C D Time (seconds) B E At which time interval is the golf cart moving fastest? A between A and B B. between B and C C. between C and D D. between D and E Distance Traveledarrow_forward
arrow_back_ios
arrow_forward_ios
Recommended textbooks for you
 MATLAB: An Introduction with ApplicationsStatisticsISBN:9781119256830Author:Amos GilatPublisher:John Wiley & Sons Inc
 Probability and Statistics for Engineering and th...StatisticsISBN:9781305251809Author:Jay L. DevorePublisher:Cengage Learning
 Statistics for The Behavioral Sciences (MindTap C...StatisticsISBN:9781305504912Author:Frederick J Gravetter, Larry B. WallnauPublisher:Cengage Learning
 Elementary Statistics: Picturing the World (7th E...StatisticsISBN:9780134683416Author:Ron Larson, Betsy FarberPublisher:PEARSON
 The Basic Practice of StatisticsStatisticsISBN:9781319042578Author:David S. Moore, William I. Notz, Michael A. FlignerPublisher:W. H. Freeman
 Introduction to the Practice of StatisticsStatisticsISBN:9781319013387Author:David S. Moore, George P. McCabe, Bruce A. CraigPublisher:W. H. Freeman

MATLAB: An Introduction with Applications
Statistics
ISBN:9781119256830
Author:Amos Gilat
Publisher:John Wiley & Sons Inc

Probability and Statistics for Engineering and th...
Statistics
ISBN:9781305251809
Author:Jay L. Devore
Publisher:Cengage Learning

Statistics for The Behavioral Sciences (MindTap C...
Statistics
ISBN:9781305504912
Author:Frederick J Gravetter, Larry B. Wallnau
Publisher:Cengage Learning

Elementary Statistics: Picturing the World (7th E...
Statistics
ISBN:9780134683416
Author:Ron Larson, Betsy Farber
Publisher:PEARSON

The Basic Practice of Statistics
Statistics
ISBN:9781319042578
Author:David S. Moore, William I. Notz, Michael A. Fligner
Publisher:W. H. Freeman

Introduction to the Practice of Statistics
Statistics
ISBN:9781319013387
Author:David S. Moore, George P. McCabe, Bruce A. Craig
Publisher:W. H. Freeman