A First Course in Probability (10th Edition)
10th Edition
ISBN: 9780134753119
Author: Sheldon Ross
Publisher: PEARSON
expand_more
expand_more
format_list_bulleted
Concept explainers
Question

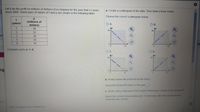
Transcribed Image Text:Let p be the profit (in millions of dollars) of a company for the year that is t years
since 2000. Some pairs of values of t and p are shown in the following table.
a. Create a scattergram of the data. Then draw a linear model.
Choose the correct scattergram below.
(millions of
dollars)
36
(years)
A.
O B.
AP
40-
1
AP
40-
32
per
28
20
6.
16
teg
0-
10
10
Complete parts a. to d
C.
D.
AP
40-
Ap
40-
ng
0-
10
10
b. Predict when the profit will be $4 million.
The profit will be $4 million in the year
c. What is the p-intercept of the model? What does it mean in this situation?
Select the correct choice below and, if necessary, fillin the answer box to
complete your choice
2022
Click to select your answer(s).
Expert Solution
This question has been solved!
Explore an expertly crafted, step-by-step solution for a thorough understanding of key concepts.
This is a popular solution
Trending nowThis is a popular solution!
Step by stepSolved in 3 steps with 1 images

Knowledge Booster
Learn more about
Need a deep-dive on the concept behind this application? Look no further. Learn more about this topic, probability and related others by exploring similar questions and additional content below.Similar questions
- x 59 63 65 69 58 77 76 69 70 64 y 72 67 78 82 75 87 92 83 87 78 Use your calculator to generate a scatter plot of the data. Don't forget to use ZoomStat to get an appropriate range of values. A reasonable freehand sketch is appropriate. Do the data form an approximate linear relationship. Explain in 1 - 2 complete sentences. Consider the notion of causation. Does attitude "cause" performance? Explain in 1 - 2 complete sentences.arrow_forwardFill in the blank. A useful tool for checking if two of the conditions for a linear model hold is a A useful tool for checking if two of the conditions for a linear model hold is a boxplot. residual plot. histogram. scatterplot.arrow_forwardThe amount of time adults spend watching television is closely monitored by firms because this helps to determine advertising pricing for commercials. Complete parts (a) through (d). (a) Do you think the variable "weekly time spent watching television" would be normally distributed? If not, what shape would you expect the variable to have? O A. The variable "weekly time spent watching television" is likely uniform, not normally distributed. O B. The variable "weekly time spent watching television" is likely skewed left, not normally distributed. O C. The variable "weekly time spent watching television" is likely normally distributed. O D. The variable "weekly time spent watching television" is likely skewed right, not normally distributed. O E. The variable "weekly time spent watching television" is likely symmetric, but not normally distributed. (b) According to a certain survey, adults spend 2.45 hours per day watching television on a weekday. Assume that the standard deviation for…arrow_forward
- How much did Patricia earn last weekarrow_forwardComplete parts (a) through (h) for the data below. x 20 30 40 50 60 D 50 y 80 75 71 64 (a) By hand, draw a scatter diagram treating x as the explanatory variable and y as the response variable. Choose the correct scatter diagram below. O A. _^) 70 10+ 10 (b) Find the equation of the line containing the points (30,75) and (60,50). y=x+ (Type integers or simplified fractions.) (c) Graph the line found in part (b) on the scatter diagram. Choose the correct graph below. OA. A 70 10+ N A) N. 70+ 10+ 0 (d) By hand, determine the least-squares regression line. II X+ (Round to three decimal places as needed.) (e) Graph the least-squares regression line on the scatter diagram. Choose the correct graph below. OA. IN 100 1. Q Q X Q Q G 100 Q (f) Compute the sum of the squared residuals for the line found in part (b). (Round to three decimal places as needed.) (g) Compute the sum of the squared residuals for the least-squares regression line found in part (d). (Round to three decimal places as…arrow_forwardMake a scatter plot of the data and determine which type of model best fits the data. (-3,-1), (-2,0), (-1,1), (0,2), (1,3), (2,4)arrow_forward
- Below is data for two variables, X and Y. Answer the questions that follow. X Y X-MX Y-MY (X-MX)2 (Y-MY)2 (X-MX)(Y-MY) 3 3 -2 -1 4 1 2 4 3 -1 -1 1 1 ___ 6 4 1 ___ 1 0 0 7 6 2 2 ___ 4 4 r = ____arrow_forwardOption C is incorrectarrow_forwardea surface temperature26.726.726.626.626.626.626.526.526.326.326.126.1Growth0.850.850.850.850.790.790.860.860.890.890.920.92 Make a scatterplot. Which is the explanatory variable? The plot shows a negative linear pattern. Explanatory Variable:arrow_forward
arrow_back_ios
SEE MORE QUESTIONS
arrow_forward_ios
Recommended textbooks for you
 A First Course in Probability (10th Edition)ProbabilityISBN:9780134753119Author:Sheldon RossPublisher:PEARSON

A First Course in Probability (10th Edition)
Probability
ISBN:9780134753119
Author:Sheldon Ross
Publisher:PEARSON
