MATLAB: An Introduction with Applications
6th Edition
ISBN: 9781119256830
Author: Amos Gilat
Publisher: John Wiley & Sons Inc
expand_more
expand_more
format_list_bulleted
Question

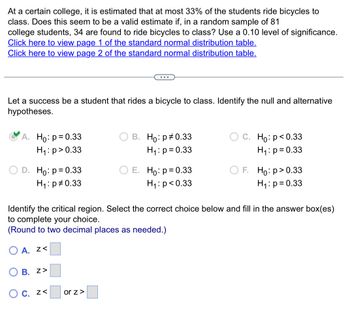
Transcribed Image Text:At a certain college, it is estimated that at most 33% of the students ride bicycles to
class. Does this seem to be a valid estimate if, in a random sample of 81
college students, 34 are found to ride bicycles to class? Use a 0.10 level of significance.
Click here to view page 1 of the standard normal distribution table.
Click here to view page 2 of the standard normal distribution table.
Let a success be a student that rides a bicycle to class. Identify the null and alternative
hypotheses.
A. Ho: p= 0.33
H₁: p > 0.33
D. Ho: p = 0.33
H₁: p0.33
B. Z>
O c. z<
B. Ho: p=0.33
H₁: p= 0.33
or z >
E. Ho: p = 0.33
H₁: p<0.33
Identify the critical region. Select the correct choice below and fill in the answer box(es)
to complete your choice.
(Round to two decimal places as needed.)
OA. Z<
C. Ho: p<0.33
H₁: p= 0.33
F. Ho: p > 0.33
H₁: p= 0.33

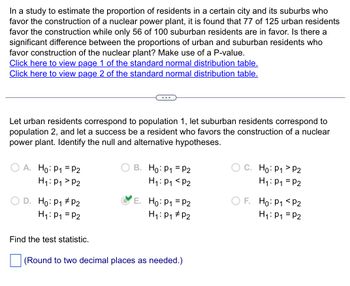
Transcribed Image Text:In a study to estimate the proportion of residents in a certain city and its suburbs who
favor the construction of a nuclear power plant, it is found that 77 of 125 urban residents
favor the construction while only 56 of 100 suburban residents are in favor. Is there a
significant difference between the proportions of urban and suburban residents who
favor construction of the nuclear plant? Make use of a P-value.
Click here to view page 1 of the standard normal distribution table.
Click here to view page 2 of the standard normal distribution table.
Let urban residents correspond to population 1, let suburban residents correspond to
population 2, and let a success be a resident who favors the construction of a nuclear
power plant. Identify the null and alternative hypotheses.
OA. Ho: P₁ P2
H₁: P₁
P2
D. Ho: P₁ P2
H₁: P₁ = P2
Find the test statistic.
B. Ho: P₁ = P2
H₁: P₁ P2
E. Ho: P₁ = P2
H₁: P₁ P₂
(Round to two decimal places as needed.)
C. Ho: P₁ P2
H₁: P₁ = P2
OF. Ho: P1
P2
H₁: P₁ = P2
Expert Solution
This question has been solved!
Explore an expertly crafted, step-by-step solution for a thorough understanding of key concepts.
Step by stepSolved in 4 steps with 1 images

Knowledge Booster
Similar questions
- More than 11% of people mind if others smoke near a building entrance. Express the null and alternative hypotheses in symbolic form for this claim.H0:H1:arrow_forwardWrite the null and alternative hypotheses for the following example. Determine if the example is a case of a two-tailed, a left-tailed, or a right-tailed test. To test if the mean credit card debt of college seniors is less than 1000 dollars. Ho: μ = 1000 dollars, H₁: μ1000 dollars, right-tailed test Ho: μ=1000 dollars, H₁: µ1000 dollars, left-tailed test Ho: μ=1000 dollars, H₁: µ‡1000 dollars, two-tailed testarrow_forwardt a nearby college, there is a school-sponsored website that matches people looking for roommates. According to the school's reports, 44% of students will find a match their first time using the site. A writer for the school newspaper tests this claim by choosing a random sample of 165 students who visited the site looking for a roommate. Of the students surveyed, 60 said they found a match their first time using the site. Complete the parts below to perform a hypothesis test to see if there is enough evidence, at the 0.10 level of significance, to reject the claim that the proportion, p , of all students who will find a match their first time using the site is 44% . erform a Z-test and find the p-value. Here is some information to help you with your Z-test. The value of the test statistic is given by −ppp−1pn . The p-value is two times the area under the curve to the left of the value of the test statistic. Standard Normal Distribution Step 1:…arrow_forward
- Let’s say your grandfather is 72 years old and your question is “Are my classmates’ grandfathers, on average, older than mine is”? What would be the null and alternative hypotheses in this scenario? Group of answer choices H0 : The population average age is less than 72. Ha : The population average age is greater than or equal to 72. The population average age is greater than 72. Ha : The population average age is less than 72. H0 : The population average age is equal to 72. Ha : The population average age is less than 72. H0 : The population average age is equal to 72. Ha : The population average age is greater than 72.arrow_forwardSubject : Statesticarrow_forwardGender of Interviewer Man Woman Women who agree 578 314 Women who disagree 322 86 Identify the null and alternative hypotheses. Choose the correct answer below. A. H0: The response of the subject and the gender of the subject are independent. H1: The response of the subject and the gender of the subject are dependent. B. H0: The proportions of agree/disagree responses are different for the subjects interviewed by men and the subjects interviewed by women. H1: The proportions are the same. C. H0: The proportions of agree/disagree responses are the same for the subjects interviewed by men and the subjects interviewed by women. H1: The proportions are different. Compute the test statistic. Find the critical value(s). What is the conclusion based on the hypothesis test? Fail to reject/ Reject H0. There is/is not sufficient evidence to warrant rejection of the claim that the…arrow_forward
- Let’s assume the average income for all majors in the School of Engineering is $80,000. However, the chair of the Computer Science department thinks their students earn more than that. Please choose the appropriate null and alternative hypotheses if the chair wanted to test this belief. a. H0: u <=80,000 Ha: u > 80,000 b. H0: u= 80000 Ha: u not= 80000 c. H0: u >80000 Ha: u < 80000 d. H0: u >80000 Ha: < 80000 e. None of the above.arrow_forwardThe academic planner of a university thinks that at least 34% of the entire student body attends summer school. Which of the following is the correct set of hypotheses to test his bélle ? Ho:p 0.34 H:ps 0.34 Ho: P2 0.34 H:p 0.34arrow_forwardLet’s say Mrs. Smith was 72 inches tall, and her question was “Are my students, on average, shorter than I am?”. What would be the null and alternative hypotheses in this scenario? A. Ho: The population average height is less than 72”. Ha: The population average height is greater than or equal to 72”. B. Ho: The population average height is greater than or equal to 72”. Ha: The population average height is less than 72”. C. Ho: The population average height is less than or equal to 72”. Ha: The population average height is greater than 72”. D. Ho: The population average height is greater than 72”. Ha: The population average height is less than 72”.arrow_forward
- State the alternative hypotheses for the following claim: Although Americans account for only 4% of the world population, they account for 35% of the world’s suicide with a firearm. State the alternative hypotheses for the following claim: Although Americans account for only 4% of the world population, they account for 35% of the world’s suicide with a firearm. p ≠ .35 p = .35 p ≥ .35 p < .35arrow_forwardA hypothesis test is to be performed. Describe the two possible outcomes of the test using the context of the given situation.Last month the average waiting time at a bank was 8.4 minutes. The manager has installed a new computer system and claims that people will no longer have to wait as long. The hypotheses are as follows:Null hypothesis: average waiting time = 8.4 minutes Alternative hypothesis: average waiting time < 8.4 minutes Rejecting the null hypothesis means there is insufficient evidence that the mean waiting time is equal to 8.4 minutes. Accepting the null hypothesis means there is evidence to conclude that the mean waiting time is equal to 8.4 minutes. Rejecting the null hypothesis means there is evidence that the mean waiting time is not equal to 8.4 minutes. Failing to reject the null hypothesis means there is insufficient evidence to conclude that the mean waiting time is less than 8.4 minutes. Rejecting the null hypothesis means there is…arrow_forward
arrow_back_ios
arrow_forward_ios
Recommended textbooks for you
 MATLAB: An Introduction with ApplicationsStatisticsISBN:9781119256830Author:Amos GilatPublisher:John Wiley & Sons Inc
 Probability and Statistics for Engineering and th...StatisticsISBN:9781305251809Author:Jay L. DevorePublisher:Cengage Learning
 Statistics for The Behavioral Sciences (MindTap C...StatisticsISBN:9781305504912Author:Frederick J Gravetter, Larry B. WallnauPublisher:Cengage Learning
 Elementary Statistics: Picturing the World (7th E...StatisticsISBN:9780134683416Author:Ron Larson, Betsy FarberPublisher:PEARSON
 The Basic Practice of StatisticsStatisticsISBN:9781319042578Author:David S. Moore, William I. Notz, Michael A. FlignerPublisher:W. H. Freeman
 Introduction to the Practice of StatisticsStatisticsISBN:9781319013387Author:David S. Moore, George P. McCabe, Bruce A. CraigPublisher:W. H. Freeman

MATLAB: An Introduction with Applications
Statistics
ISBN:9781119256830
Author:Amos Gilat
Publisher:John Wiley & Sons Inc

Probability and Statistics for Engineering and th...
Statistics
ISBN:9781305251809
Author:Jay L. Devore
Publisher:Cengage Learning

Statistics for The Behavioral Sciences (MindTap C...
Statistics
ISBN:9781305504912
Author:Frederick J Gravetter, Larry B. Wallnau
Publisher:Cengage Learning

Elementary Statistics: Picturing the World (7th E...
Statistics
ISBN:9780134683416
Author:Ron Larson, Betsy Farber
Publisher:PEARSON

The Basic Practice of Statistics
Statistics
ISBN:9781319042578
Author:David S. Moore, William I. Notz, Michael A. Fligner
Publisher:W. H. Freeman

Introduction to the Practice of Statistics
Statistics
ISBN:9781319013387
Author:David S. Moore, George P. McCabe, Bruce A. Craig
Publisher:W. H. Freeman