Chemistry
10th Edition
ISBN: 9781305957404
Author: Steven S. Zumdahl, Susan A. Zumdahl, Donald J. DeCoste
Publisher: Cengage Learning
expand_more
expand_more
format_list_bulleted
Concept explainers
Question
Hello, based on this graph and table,
how can i solve for to find experimental pKa using the half equivalence point? and Ka of acetic acid?

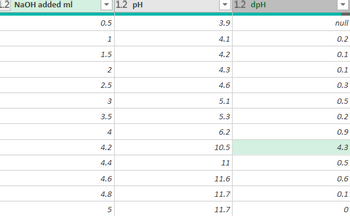
Transcribed Image Text:This table presents data on the addition of sodium hydroxide (NaOH) to a solution and the corresponding changes in pH and delta pH (dpH).
### Table: NaOH Addition and pH Measurements
| NaOH added (mL) | pH | dpH |
|-----------------|----|-----|
| 0.5 | 3.9| null|
| 1.0 | 4.1| 0.2 |
| 1.5 | 4.2| 0.1 |
| 2.0 | 4.3| 0.1 |
| 2.5 | 4.6| 0.3 |
| 3.0 | 5.1| 0.5 |
| 3.5 | 5.3| 0.2 |
| 4.0 | 6.2| 0.9 |
| 4.2 |10.5| 4.3 |
| 4.4 |11.0| 0.5 |
| 4.6 |11.6| 0.6 |
| 4.8 |11.7| 0.1 |
| 5.0 |11.7| 0.0 |
### Explanation:
- **NaOH added (mL)**: This column lists the volume of sodium hydroxide in milliliters that has been added to the solution.
- **pH**: This column lists the corresponding pH values of the solution after the addition of NaOH. The pH is a measure of the acidity or basicity of the solution, with values below 7 indicating an acidic solution, and values above 7 indicating a basic solution.
- **dpH**: This column lists the change in pH between successive measurements. The value of "null" in the first row indicates that there is no previous value to compare to for a change in pH.
The data shows a trend of increasing pH with the addition of NaOH, which is expected as NaOH is a strong base. There is a notable jump in pH from 6.2 to 10.5 when 4.2 mL of NaOH is added, indicating a sharp rise in alkalinity. This may suggest the completion of neutralization of any present acidic components around that

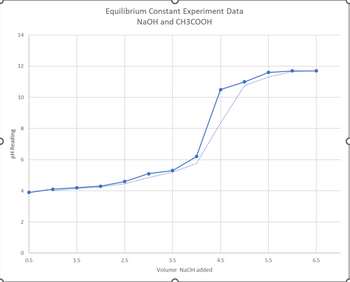
Transcribed Image Text:## Equilibrium Constant Experiment Data: NaOH and CH3COOH
### Experiment Overview
This graph represents data collected from an experiment to determine the equilibrium constant of a reaction between sodium hydroxide (NaOH) and acetic acid (CH3COOH).
### Graph Description
#### Title:
Equilibrium Constant Experiment Data: NaOH and CH3COOH
#### Axes:
- **X-axis:** Volume of NaOH added (in mL)
- **Y-axis:** pH Reading
#### Data Points:
The graph illustrates the relationship between the volume of NaOH added to a solution of acetic acid and the resulting pH of the solution.
#### Interpretation:
- At the beginning of the experiment (0.5 to around 3.5 mL of NaOH added), the pH increases gradually from approximately 4 to around 6. This phase represents the buffering region of the acetic acid solution.
- A sharp increase in pH is observed between 3.5 mL and 4.5 mL of NaOH added, where the pH rises steeply from about 6 to 12.5. This significant increase indicates the equivalence point where the amount of NaOH added is stoichiometrically equivalent to the acetic acid present in the solution.
- Beyond the equivalence point (greater than 4.5 mL), the pH levels off, stabilizing around 12 to 12.5, reflecting the excess NaOH in the solution.
### Conclusion:
The equilibrium point in the graph is determined by the steepest rise in the pH values, indicating the reaction completion between NaOH and CH3COOH. Understanding this data is crucial for calculating the equilibrium constant and understanding the acid-base neutralization dynamics.
Expert Solution
This question has been solved!
Explore an expertly crafted, step-by-step solution for a thorough understanding of key concepts.
Step by stepSolved in 3 steps with 3 images

Knowledge Booster
Learn more about
Need a deep-dive on the concept behind this application? Look no further. Learn more about this topic, chemistry and related others by exploring similar questions and additional content below.Similar questions
- 1. NH3, pyridine NH2 2. LIAIH4, Et20 3. H* workup 1. SOCI, 2. ELOH OEt 1. CrO3, pyridine NH2 2. , рH 5 1.CrОз, Н2О OMe 2. МеОН, Н* cat. 1. PhMgBr (excess), Et,0 2. H* workup Ph Ph 3. H* cat.arrow_forwardUtilizing Henderson-Hasselbach Equation, how to solve the given equation below? Determine and solve for the pKa of formic acid when the pH of a given buffer system containing an equimolar amounts of formic acid and formate has a pH of 2.50.arrow_forwardPut the following bases in order from weakest to strongest and explain why. Cute specific pKa values of conjugate acids to answer this question.arrow_forward
- c-please see attachedarrow_forwardIf the concentration of an acid in solution is 2.2 times larger than the concentration of its conjugate base, and the pH of the solution is 3.5, what is the pKa of the acid? Include the answer to 3 significant figuresarrow_forwardPlease solve the problem max in 30-60 minutes thank u Problem Does the classification of these compounds include flavonoids,alkaloids and so on? Solve with the step Information IUPAC ZINC08297406 (C17H18N2O4) and ZINC04236114 (C17H20N4O4) (Figure 14 and Figure 15). ZINC08297406 and ZINC04236114 have the IUPAC names 3-[(3S,3aR,6R,6aR)-6-hydroxy-hexahydrofuro[3,2-b]furan-3-yl]-1-(naphthalene-1-yl)urea and N -[(6S,7S)-2,8-dioxo-3,9-diazatricyclo[8.4.0.0³,⁷]tetradeca-1(10),11,13-trien-6-yl]morpholine-4-carboxamidearrow_forward
- Solve correctly please. CAN YOU PLEASE EXPLAIN?arrow_forwardCould someone Please help with this! No plagirism Please! Station #7 = H2SO3 (aq) For this acid, what does the white bead represent?________ blue bead? __________ 3rd Color Bead? _________ Why are there two blue beads attached to each 3rd colored bead? Do all the H+ ionize from the A–1 ion at one time? How do you know? Record your observations in the particulate drawing. How many acid molecules have broken into ions? Determine the % ionization for the acid. Write the ionization reaction for this acid. ________ ↔ ______ + _______arrow_forwardPlease don't provide handwritten solution ......arrow_forward
arrow_back_ios
arrow_forward_ios
Recommended textbooks for you
 ChemistryChemistryISBN:9781305957404Author:Steven S. Zumdahl, Susan A. Zumdahl, Donald J. DeCostePublisher:Cengage Learning
 ChemistryChemistryISBN:9781259911156Author:Raymond Chang Dr., Jason Overby ProfessorPublisher:McGraw-Hill Education
 Principles of Instrumental AnalysisChemistryISBN:9781305577213Author:Douglas A. Skoog, F. James Holler, Stanley R. CrouchPublisher:Cengage Learning
 Organic ChemistryChemistryISBN:9780078021558Author:Janice Gorzynski Smith Dr.Publisher:McGraw-Hill Education
 Chemistry: Principles and ReactionsChemistryISBN:9781305079373Author:William L. Masterton, Cecile N. HurleyPublisher:Cengage Learning
 Elementary Principles of Chemical Processes, Bind...ChemistryISBN:9781118431221Author:Richard M. Felder, Ronald W. Rousseau, Lisa G. BullardPublisher:WILEY

Chemistry
Chemistry
ISBN:9781305957404
Author:Steven S. Zumdahl, Susan A. Zumdahl, Donald J. DeCoste
Publisher:Cengage Learning

Chemistry
Chemistry
ISBN:9781259911156
Author:Raymond Chang Dr., Jason Overby Professor
Publisher:McGraw-Hill Education

Principles of Instrumental Analysis
Chemistry
ISBN:9781305577213
Author:Douglas A. Skoog, F. James Holler, Stanley R. Crouch
Publisher:Cengage Learning

Organic Chemistry
Chemistry
ISBN:9780078021558
Author:Janice Gorzynski Smith Dr.
Publisher:McGraw-Hill Education

Chemistry: Principles and Reactions
Chemistry
ISBN:9781305079373
Author:William L. Masterton, Cecile N. Hurley
Publisher:Cengage Learning

Elementary Principles of Chemical Processes, Bind...
Chemistry
ISBN:9781118431221
Author:Richard M. Felder, Ronald W. Rousseau, Lisa G. Bullard
Publisher:WILEY