
MATLAB: An Introduction with Applications
6th Edition
ISBN: 9781119256830
Author: Amos Gilat
Publisher: John Wiley & Sons Inc
expand_more
expand_more
format_list_bulleted
Related questions
Question

Transcribed Image Text:Internet Users versus Award Winners
Internet Users Award Winners
(per 100)
(per 10 million)
76.8
81.0
81.9
40.6
84.1
41.0
85.3
89.9
78.5
83.0
52.5
77.8
59.2
77.6
89.3
90.1
67.3
60.7
67.8
92.8
85.7
90.4
79.9
Print
5.9
24.6
8.8
1.1
7.0
0.1
24.2
8.0
9.5
14.0
0.7
13.9
2.8
0.6
10.9
25.0
4.2
2.9
2.6
32.3
30.5
17.9
11.1
-
Done
X
numbers of Internet users per 100 people and numbers of scientific award winners per 10 million people for different countries. Construct a scatterplot, find the value
tr, and find the P-value of r. Determine whether there is sufficient evidence to support a claim of linear correlation between the two variables. Use a significance level
ernet users and scientific award winners.
he correct graph below.
sr=
s needed.)
hypotheses.
ot round.)
needed.)
s needed.)
OB.
40-
32+
24-
164
+2
offf
0
0 20 40 60 80 100
Internet Users
84
Q
Q
G
C
O C.
40
32-
24-
16-
8-
0-
H|||||444
0 20 40 60 80 100
Internet Users
Q
O D.
40
32
24-
H
117
16+++
8-1
++++
of||||||||H
8+
0 20 40 60 80 100
Internet Users
04
Q
Q
G

Transcribed Image Text:tion list
estion 11
estion 12
Question 13
Question 14
Question 15
Question 16
O Question 17
O Question 18
Question 19
K
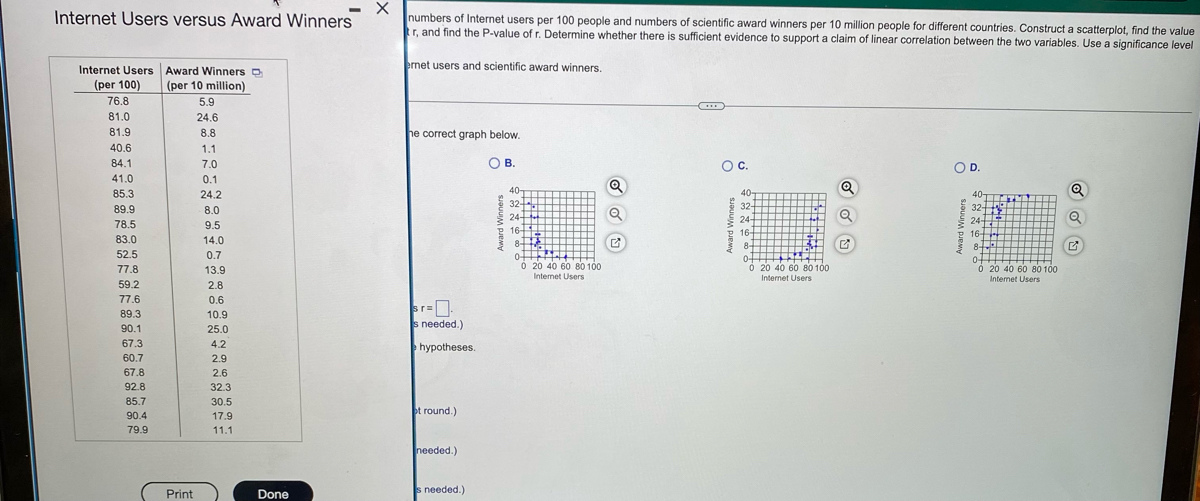
The accompanying table lists the numbers of Internet users per 100 people and numbers of scientific award winners per 10 million people for different countries. Construct a scatterplot, find the value
of the linear correlation coefficient r, and find the P-value of r. Determine whether there is sufficient evidence to support a claim of linear correlation between the two variables. Use a significance level
of α=0.01.
Click to view the data on Internet users and scientific award winners.
Construct a scatterplot. Choose the correct graph below.
OB.
A.
40-
32-
24+
16-
8-
0-
0 20 40 60 80 100
Internet Users
The linear correlation coefficient is r=.
(Round to three decimal places as needed.)
Determine the null and alternative hypotheses.
Ho: P
H₁: p
(Type integers or decimals. Do not round.)
The test statistic is t=0
(Round to two decimal places as needed.)
The P-value is
(Round to three decimal places as needed.)
40-
32-
32
24+
164
8-
0-
HE
||||||||||
0 20 40 60 80 100
Internet Users
Q
G
***
O C.
40-
32-
24-
16-
8-
3
0-
o+HT
0 20 40 60 80 100
Internet Users
Q
Q
OD.
40-
€ 321 13
32-
247
TIMTM
16-
8+
o+|||||||||
04
0 20 40 60 80 100
Internet Users
Q
Q
Expert Solution
This question has been solved!
Explore an expertly crafted, step-by-step solution for a thorough understanding of key concepts.

Step by stepSolved in 3 steps with 19 images

Knowledge Booster

Similar questions
- Listed below are numbers of Internet users per 100 people and numbers of scientific award winners per 10 million people for different countries. Construct a scatterplot, find the value of the linear correlation coefficient r, and find the P-value of r. Determine whether there is sufficient evidence to support a claim of linear correlation between the two variables. Use a significance level of a =0.05. Internet Users 79.9 79.4 55.8 67.9 77.3 39.0 Award Winners 5.4 9.1 3.4 1.8 10.6 0.1 Construct a scatterplot. Choose the correct graph below. O A. В. C. D. 12- 12- 12- 12- 0+ 30 0+ 30 0- 30 90 90 30 90 90 Internet Users Internet Users Internet Users Internet Users The linear correlation coefficient is r= (Round to three decimal places as needed.)arrow_forwardThe accompanying table lists the ages of acting award winners matched by the years in which the awards were won. Construct a scatterplot, find the value of the linear correlation coefficient r, and find the P-value of r. Determine whether there is sufficient evidence to support a claim of linear correlation between the two variables. Should we expect that there would be a correlation? Use a significance level of α=0.05. Best Actress - Best Actor 27 - 41 30 - 35 29 - 36 61 - 45 31 - 52 34 - 46 45 - 62 30 - 52 60 - 38 23 - 52 44 - 44 52 - 32 what is the linear coefficient?arrow_forwardfind linear correlation coefficient, P value, and test statistic.arrow_forward
- confusedarrow_forwardThe accompanying table lists the ages of acting award winners matched by the years in which the awards were won. Construct a scatterplot, find the value of the linear correlation coefficient r, and find the P-value of r. Determine whether there is sufficient evidence to support a claim of linear correlation between the two variables. Should we expect that there would be a correlation? Use a significance level of α=0.05. LOADING... Click the icon to view the ages of the award winners. Construct a scatterplot. Choose the correct graph below. A. 20702070Best Actress (years)Best Actor (years) A scatterplot has a horizontal axis labeled Best Actress in years from 20 to 70 in increments of 5 and a vertical axis labeled Best Actor in years from 20 to 70 in increments of 5. Twelve points are plotted. Eleven of the plotted points follow the pattern of a line rising from left to right passing through the points (24, 38) and (66, 58). An…arrow_forwardThe table below includes data from taxi rides. The distances are in miles, the times are in minutes, the fares are in dollars, and the tips are in dollars. Is there sufficient evidence to conclude that there is a linear correlation between the time of the ride and the tip amount? Construct a scatterplot, find the value of the linear correlation coefficient r, and find the P-value of r. Determine whether there is sufficient evidence to support a claim of linear correlation between the two variables. Use a significance level of a = 0.01. Does it appear that riders base their tips on the time of the ride? Click here for information on the taxi rides. Construct a scatterplot. Choose the correct graph below. O A. Tip Amount ($) 25- Q 0 35 G Ride time (minutes) Determine the linear correlation coefficient. The linear correlation coefficient is r= (Round to three decimal places as needed.) Tip Amount ($) B. 25- 0- 0 35 G Ride time (minutes) Taxi data ip Amount (S C. 25- 0- 35 Ride time…arrow_forward
- The data shown below consists of the price (in dollars) of 7 events at a local venue and the number of people who attended. Determine if there is significant negative linear correlation between ticket price and number of attendees. Use a significance level of 0.05 and round all values to 4 decimal places. Ticket Price Attendence 6. 109 10 114 14 139 18 142 22 139 26 132 30 154 Но: = 0 На: р Find the Linear Correlation Coefficient r = Find the p-value p-value = %3D The p-value is Less than (or equal to) a Greater than a The p-value leads to a decision to Reject Ho Аcсept Ho Do Not Reject Ho The conclusion is There is a significant linear correlation between ticket price and attendance. There is a significant negative linear correlation between ticket price and attendance. There is a significant positive linear correlation between ticket price and attendance. There is insufficient evidence to make a conclusion about the linear correlation between ticket price and attendance.arrow_forwardOA. Tip Amount ($) Construct a scatterplot. Choose the correct graph below. 25- The table below includes data from taxi rides. The distances are in miles, the times are in minutes, the fares are in dollars, and the tips are in dollars. Is there sufficient evidence to conclude that there is a linear correlation between the time of the ride and the tip amount? Construct a scatterplot, find the value of the linear correlation coefficient r, and find the P-value of r. Determine whether there is sufficient evidence to support a claim of linear correlation between the two variables. Use a significance level of a 0.01. Does it appear that riders base their tips on the time of the ride? Click here for information on the taxi rides. 0 35 Ride time (minutes) Determine the linear correlation coefficient. The linear correlation coefficient is r= (Round to three decimal places as needed.) Tip Amount ($) B. Q 25- Q 0- 0 35 Ride time (minutes) Tip Amount ($) C. 25- Q 0 35 G Ride time (minutes) O D.…arrow_forwardThe accompanying table lists the ages of acting award winners matched by the years in which the awards were won. Construct a scatterplot, find the value of the linear correlation coefficient r, and find the P-value of r. Determine whether there is sufficient evidence to support a claim of linear correlation between the two variables. Should we expect that there would be a correlation? Use a significance level of a=0.05. Click the icon to view the ages of the award winners. Construct a scatterplot. Choose the correct graph below. A. 20- 20 E 70 OB. 70- 20+ 20 70 Best Actress (years) The linear correlation coefficient is r= (Round to three decimal places as nee Best Actress (years) Best Actresses and Best Actors Best Actress 28 31 30 64 31 Best Actor 44 39 37 43 49 33 46 47 56 OC. COD. Q 70- 20 20 Best Actress (years) 30 59 23 42 53 442 52 39 56 44 34 70 20 20 70 Best Actress (years)arrow_forward
- The accompanying table lists the ages of acting award winners matched by the years in which the awards were won. Construct a scatterplot, find the value of the linear correlation coefficient r, and find the P-value of r. Determine whether there is sufficient evidence to support a claim of linear correlation between the two variables. Should we expect that there would be a correlation? Use a significance level of a = 0.01. Click the icon to view the ages of the award winners. Construct a scatterplot. Choose the correct graph below. OA. 70- Best Actor (years) 20+ 20 Q [ 70 Best Actress (years) The linear correlation coefficient is r= ☐ (Round to three decimal places as needed.). B. OC. Q 70- 70- Q 20- 20 20- 70 20 70 Best Actress (years) Best Actress (years) Best Actresses and Best Actors Best Actress 29 29 28 57 31 32 45 28 63 22 42 51D Best Actor 45 39 39 47 51 49 64 48 38 55 43 34 O D. 70- Q G 20 20 70 Best Actress (years)arrow_forwardthe accompanying table shows the ages (in years) of 11 children and the numbers of words in their vocabulary. Age, x Vocabulary size, y1 32 2603 5904 11005 19006 25003 7305 22002 2504 13006 2400 1. Calculate the sample correlation coefficient r. 2. Describe the type of correlation, if any, and interpret the correlation in the context of the data. 3. Use the table of critical values for the Pearson correlation coefficient to make a conclusion about the correlation coefficient. Let α=0.01.arrow_forwardconfusedarrow_forward
arrow_back_ios
arrow_forward_ios
Recommended textbooks for you
- MATLAB: An Introduction with ApplicationsStatisticsISBN:9781119256830Author:Amos GilatPublisher:John Wiley & Sons Inc
 Probability and Statistics for Engineering and th...StatisticsISBN:9781305251809Author:Jay L. DevorePublisher:Cengage Learning
 Statistics for The Behavioral Sciences (MindTap C...StatisticsISBN:9781305504912Author:Frederick J Gravetter, Larry B. WallnauPublisher:Cengage Learning
  Elementary Statistics: Picturing the World (7th E...StatisticsISBN:9780134683416Author:Ron Larson, Betsy FarberPublisher:PEARSON
 The Basic Practice of StatisticsStatisticsISBN:9781319042578Author:David S. Moore, William I. Notz, Michael A. FlignerPublisher:W. H. Freeman
 Introduction to the Practice of StatisticsStatisticsISBN:9781319013387Author:David S. Moore, George P. McCabe, Bruce A. CraigPublisher:W. H. Freeman
MATLAB: An Introduction with Applications
Statistics
ISBN:9781119256830
Author:Amos Gilat
Publisher:John Wiley & Sons Inc
Probability and Statistics for Engineering and th...
Statistics
ISBN:9781305251809
Author:Jay L. Devore
Publisher:Cengage Learning
Statistics for The Behavioral Sciences (MindTap C...
Statistics
ISBN:9781305504912
Author:Frederick J Gravetter, Larry B. Wallnau
Publisher:Cengage Learning
Elementary Statistics: Picturing the World (7th E...
Statistics
ISBN:9780134683416
Author:Ron Larson, Betsy Farber
Publisher:PEARSON
The Basic Practice of Statistics
Statistics
ISBN:9781319042578
Author:David S. Moore, William I. Notz, Michael A. Fligner
Publisher:W. H. Freeman
Introduction to the Practice of Statistics
Statistics
ISBN:9781319013387
Author:David S. Moore, George P. McCabe, Bruce A. Craig
Publisher:W. H. Freeman