
MATLAB: An Introduction with Applications
6th Edition
ISBN: 9781119256830
Author: Amos Gilat
Publisher: John Wiley & Sons Inc
expand_more
expand_more
format_list_bulleted
Related questions
Question

Transcribed Image Text:K
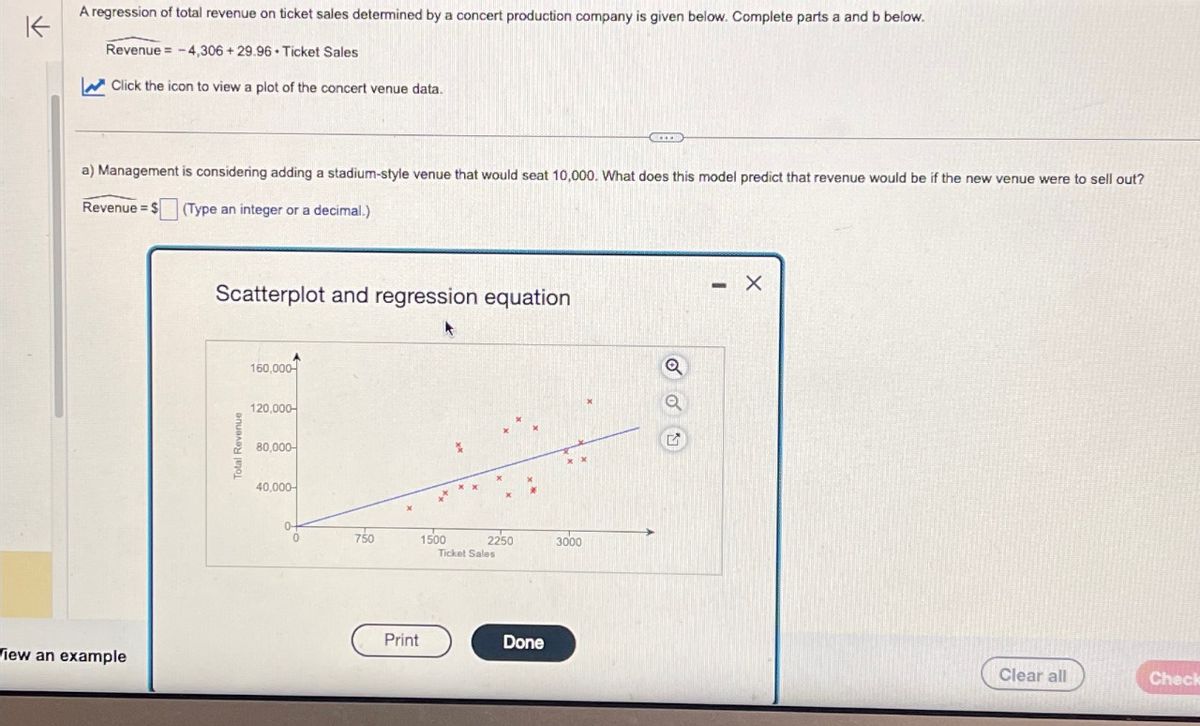
A regression of total revenue on ticket sales determined by a concert production company is given below. Complete parts a and b below.
Revenue -4,306+29.96. Ticket Sales
Click the icon to view a plot of the concert venue data.
a) Management is considering adding a stadium-style venue that would seat 10,000. What does this model predict that revenue would be if the new venue were to sell out?
Revenue = $(Type an integer or a decimal.)
iew an example
Scatterplot and regression equation
Revenue
A
160,000-
120,000
80,000-
40,000
0-
0
750
1500
Print
2250
Ticket Sales
Done
CEED
3000
- X
Clear all
Check
Expert Solution
This question has been solved!
Explore an expertly crafted, step-by-step solution for a thorough understanding of key concepts.

This is a popular solution

Trending nowThis is a popular solution!

Step by stepSolved in 3 steps

Knowledge Booster

Similar questions
- Fat (9) 31 39 19 34 43 39 35 Calories 580 680 410 590 | 660 640 570 8. Make a scatter plot of the data. 700 650 * 600 550 500 450 400 O 10 20 30 40 50 x Fat (g) Desertee the COFrelation Use technology to find the equation of the best-fitting line for the data. Graph the best-fitting line for the data on the scatter plot. Predict the number of calories in a hamburger that contains 34 grams óf fat. Caloriesarrow_forwardThe table describes the height of a weather balloon, in meters, minutes after its launch. Time (minutes) Height (meters) 0 60 1 68.2 2 74.3 3 80.9 4 89.7 8 128.5 Select which equation best models the data. O O O O y = 8.52 +58 y = 8.2x + 60 y = 11.4x +57 y = 11.8x + 54arrow_forwardI need help solvingarrow_forward
- The following table shows retail sales in drug stores in billions of dollars in the U.S. for years since 1995. Year Retail Sales 85.851 3 108.426 141.781 169.256 12 202.297 15 222.266 Let S(t) be the retails sales in billions of dollars in t years since 1995. A linear model for the data is S(t) = 9.44t + 84.182. 220 210- 200 190 180 170- 160 150 140 130 120 110 100 90 12 804arrow_forwardA researcher is interested in understanding the relationship between ife stress (Variable X) and quality of life (Varlable Y). Using the whiteboard, plot the data below Into a scatterplot and comment on the type of relationship you see between life stress and quality of life. BE SURE AND SAVE YOUR PICTURE. 3. 3. Aa strokearrow_forwardQuestion is in picarrow_forward
arrow_back_ios
arrow_forward_ios
Recommended textbooks for you
- MATLAB: An Introduction with ApplicationsStatisticsISBN:9781119256830Author:Amos GilatPublisher:John Wiley & Sons Inc
 Probability and Statistics for Engineering and th...StatisticsISBN:9781305251809Author:Jay L. DevorePublisher:Cengage Learning
 Statistics for The Behavioral Sciences (MindTap C...StatisticsISBN:9781305504912Author:Frederick J Gravetter, Larry B. WallnauPublisher:Cengage Learning
  Elementary Statistics: Picturing the World (7th E...StatisticsISBN:9780134683416Author:Ron Larson, Betsy FarberPublisher:PEARSON
 The Basic Practice of StatisticsStatisticsISBN:9781319042578Author:David S. Moore, William I. Notz, Michael A. FlignerPublisher:W. H. Freeman
 Introduction to the Practice of StatisticsStatisticsISBN:9781319013387Author:David S. Moore, George P. McCabe, Bruce A. CraigPublisher:W. H. Freeman
MATLAB: An Introduction with Applications
Statistics
ISBN:9781119256830
Author:Amos Gilat
Publisher:John Wiley & Sons Inc
Probability and Statistics for Engineering and th...
Statistics
ISBN:9781305251809
Author:Jay L. Devore
Publisher:Cengage Learning
Statistics for The Behavioral Sciences (MindTap C...
Statistics
ISBN:9781305504912
Author:Frederick J Gravetter, Larry B. Wallnau
Publisher:Cengage Learning
Elementary Statistics: Picturing the World (7th E...
Statistics
ISBN:9780134683416
Author:Ron Larson, Betsy Farber
Publisher:PEARSON
The Basic Practice of Statistics
Statistics
ISBN:9781319042578
Author:David S. Moore, William I. Notz, Michael A. Fligner
Publisher:W. H. Freeman
Introduction to the Practice of Statistics
Statistics
ISBN:9781319013387
Author:David S. Moore, George P. McCabe, Bruce A. Craig
Publisher:W. H. Freeman