MATLAB: An Introduction with Applications
6th Edition
ISBN: 9781119256830
Author: Amos Gilat
Publisher: John Wiley & Sons Inc
expand_more
expand_more
format_list_bulleted
Concept explainers
Question
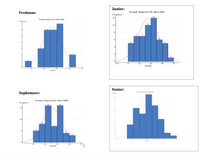
Which of these graphs show a

Transcribed Image Text:Junior:
Freshman:
Normal: Mean=23.792, SD=4.4951
Frequency
12
12
Normal: Mean=23.12, SD=3.8004
Frequency
10
10-
6
8
7
7
5.
6.
5
3
To
15
20
25
30
35
MАTH
15
20
30
ΜΑΤΗ
Senior:
Sophomore:
Normal: Meun=21.222, SD-3.2608
Frequeacy
Normal: Mean=22.847, SD=3.9558
Frequency
16
16
15
10
2'5
MATH
15
20
25
30
35
МАTH
Expert Solution
This question has been solved!
Explore an expertly crafted, step-by-step solution for a thorough understanding of key concepts.
This is a popular solution
Trending nowThis is a popular solution!
Step by stepSolved in 2 steps with 1 images

Knowledge Booster
Learn more about
Need a deep-dive on the concept behind this application? Look no further. Learn more about this topic, statistics and related others by exploring similar questions and additional content below.Similar questions
- Section 5.4 (please help with TI-84 calculator if possible) The lengths of lumber a machine cuts are normally distributed with a a mean of a 104 inches and a standard deviation of 0.5 inch. (A) what is the probability that a randomly selected board cut by the machine has a length greater than 104.23 inches? (B) A sample of 40 boards is randomly selected. What is the probability that their mean length is greater than 104.23 inches? (A) The probability is ________ (B) The probability is________ (Round to 4 decimal places as needed)arrow_forwardRandom samples of a Gaussian distribution will fall within two standard deviations of the mean with a probability which is approximately 68%. True or Falsearrow_forwardWhat are the predictor variables in general and what we can observe in general—normal distribution, skewed in any plot or grapharrow_forward
- Does playing Mozart for unborn babies result in having children with higher IQs? A psychologist obtains a random sample of 30 mothers in the first trimester of their pregnancy. The mothers are asked to play Mozart in the house at least 45 minutes each day until they give birth. We know that IQs are normally distributed with a mean of 100. A few years after their births the children were given an IQ test and the IQs of the 30 children in the study resulted in a sample mean of 104.2. Assume the population standard deviation for IQ of children is 15. Is there evidence that the children who listen to Mozart for at least 45 minutes each day during pregnancy have higher IQs at the 0.05 level of significance? Use the p-value approach. a. Define the parameter we are testing and setup a hypothesis test to see if the mean IQ of children who listened to Mozart at least 45 minutes a day during pregnancy is higher than the national mean of 100: b. Calculate the test statistics for this…arrow_forwardWhat does it mean to say that the graph of the normal distribution is symmetric?arrow_forwardDoes playing Mozart for unborn babies result in having children with higher IQs? A psychologist obtains a random sample of 30 mothers in the first trimester of their pregnancy. The mothers are asked to play Mozart in the house at least 45 minutes each day until they give birth. We know that IQs are normally distributed with a mean of 100. A few years after their births the children were given an IQ test and the IQs of the 30 children in the study resulted in a sample mean of 104.2. Assume the population standard deviation for IQ of children is 15. Is there evidence that the children who listen to Mozart for at least 45 minutes each day during pregnancy have higher IQs at the 0.05 level of significance? Use the p-value approach. Select the correct conclusion for this test: We fail to reject the null hypothesis because the p-value is less than the level of significance. We fail to reject the null hypothesis because the p-value is greater than the level of significance. We…arrow_forward
arrow_back_ios
arrow_forward_ios
Recommended textbooks for you
 MATLAB: An Introduction with ApplicationsStatisticsISBN:9781119256830Author:Amos GilatPublisher:John Wiley & Sons Inc
 Probability and Statistics for Engineering and th...StatisticsISBN:9781305251809Author:Jay L. DevorePublisher:Cengage Learning
 Statistics for The Behavioral Sciences (MindTap C...StatisticsISBN:9781305504912Author:Frederick J Gravetter, Larry B. WallnauPublisher:Cengage Learning
 Elementary Statistics: Picturing the World (7th E...StatisticsISBN:9780134683416Author:Ron Larson, Betsy FarberPublisher:PEARSON
 The Basic Practice of StatisticsStatisticsISBN:9781319042578Author:David S. Moore, William I. Notz, Michael A. FlignerPublisher:W. H. Freeman
 Introduction to the Practice of StatisticsStatisticsISBN:9781319013387Author:David S. Moore, George P. McCabe, Bruce A. CraigPublisher:W. H. Freeman

MATLAB: An Introduction with Applications
Statistics
ISBN:9781119256830
Author:Amos Gilat
Publisher:John Wiley & Sons Inc

Probability and Statistics for Engineering and th...
Statistics
ISBN:9781305251809
Author:Jay L. Devore
Publisher:Cengage Learning

Statistics for The Behavioral Sciences (MindTap C...
Statistics
ISBN:9781305504912
Author:Frederick J Gravetter, Larry B. Wallnau
Publisher:Cengage Learning

Elementary Statistics: Picturing the World (7th E...
Statistics
ISBN:9780134683416
Author:Ron Larson, Betsy Farber
Publisher:PEARSON

The Basic Practice of Statistics
Statistics
ISBN:9781319042578
Author:David S. Moore, William I. Notz, Michael A. Fligner
Publisher:W. H. Freeman

Introduction to the Practice of Statistics
Statistics
ISBN:9781319013387
Author:David S. Moore, George P. McCabe, Bruce A. Craig
Publisher:W. H. Freeman