
ENGR.ECONOMIC ANALYSIS
14th Edition
ISBN: 9780190931919
Author: NEWNAN
Publisher: Oxford University Press
expand_more
expand_more
format_list_bulleted
Related questions
Question
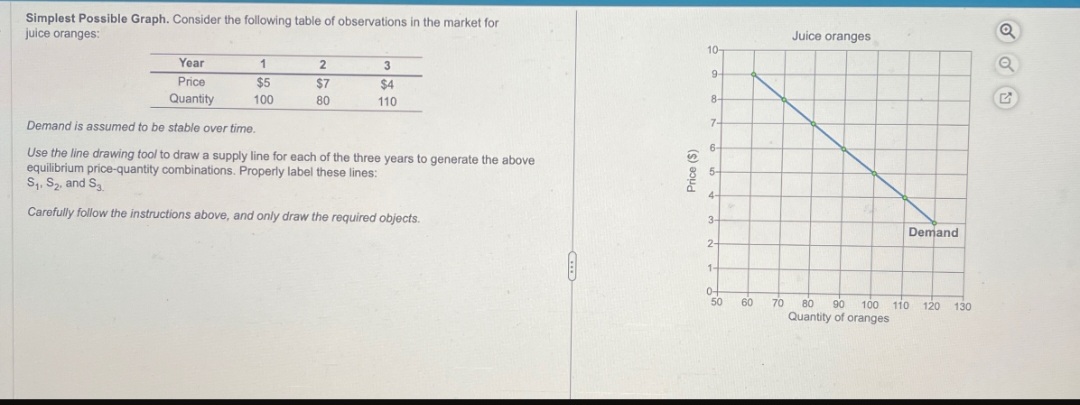

Transcribed Image Text:Simplest Possible Graph. Consider the following table of observations in the market for
juice oranges:
Year
1
2
3
Price
Quantity
$5
$7
$4
100
80
110
Demand is assumed to be stable over time.
Use the line drawing tool to draw a supply line for each of the three years to generate the above
equilibrium price-quantity combinations. Properly label these lines:
S₁, S2, and S3.
Carefully follow the instructions above, and only draw the required objects.
Price ($)
10-
9-
8-
7-
6-
4-
3-
Juice oranges
Demand
2-
1-
o+
50 60
70 80 90 100 110
120
130
Quantity of oranges
G
Expert Solution
This question has been solved!
Explore an expertly crafted, step-by-step solution for a thorough understanding of key concepts.

Step by stepSolved in 3 steps with 2 images

Knowledge Booster


Learn more about
Need a deep-dive on the concept behind this application? Look no further. Learn more about this topic, economics and related others by exploring similar questions and additional content below.Similar questions
- 2. Assume that a firm has the following production function; q = L0.5K0.5. Its capital is fixed at K = 1. It faces a rental rate of r = $90 and a wage rate of W = $10. d. Determine the average, average variable, and average fixed cost functions. e. Determine the marginal cost function. f. Calculate the lowest cost, and associated quantity, that the firm can produce this good for in the short run.arrow_forwardSuppose that you are the vice president of operations of a manufacturing firm that sells an industrial lubricant. Further suppose that your economist gives you the following supply and demand equations: Supply equation: QS = 0.5P-20 Demand equation: P = 100 a ) Calculate the equilibrium price and quantity that characterizes this good b) Graphically show the market equilibrium price and quantity you found in part a). Please label this point "A". c) Suppose that the local government imposes a $4 per-unit sales tax on consumers. Calculate the new equilibrium price and quantity that characterizes this good under this new scenario. d) Graphically show the new market equilibrium on the graph you drew in part b). Please label this point "B".arrow_forwardPlease assistarrow_forward
- I need some help Consider the equations and graphs for the demand and supply functions given below. Then answer the following questions. P=5Q^2+72Q P=-Q^2-3Q+20.23 State the domain for these curves for the analysis to be valid. (Answer to 2 decimal places)arrow_forwardYou are a financial analyst with a specialization in the motion pictureIndustry. You have been hired to analyze the prices of movie theater tickets. The following two events are occurring simultaneously in the Ghana:A new national chain opens new multi-screen movie theaters in most cities in Ghana.Movie theaters cut the price of popcorn and soft drinks in half.Draw a demand-and-supply graph showing equilibrium in the market for movie tickets hefore the above two events took place. Label the axes and curves. Label the initial equilibrium — before events (i) and (ii) - as P,and Q, on your graph.b.Now show on your graph how event (i) affects the demand or supply curves for tone teres, Brelly explain which of the demand or supply variables caused the eftect you are showing on your graph.Now slow on your graph how event (il) affects the demand or supply curves for ovis Lesets. Brielly explain which of the demand or supply variables caused the effe you are showing on your graph.Based on your…arrow_forward= D(x) = 23 Espacio en Blanco 1: Espacio en Blanco 2: Espacio en Blanco 3: P = 1 X 20 and the price-supply equation = S(x) P = Given the price-demand equation (A) Find the equilibrium price. Answer: The equilibrium price is $ (use 2 decimal places) (B) The total gain to producers who are willing to supply units at a lower price is $ (C) The total savings to consumers who are willing to pay a higher price for the product is $ = 8+ 1 8000 (round to 2 decimal places) (use 2 decimal places)arrow_forward
- QUESTION 25 Assume that there is a rise in common cold and cough in the winter months. On the other hand there is a low production of over the counter cold/cough medications How this combined situation will affect the price and quantity of such medications. Note: Make sure to explain all the steps of your analysisarrow_forwardNonearrow_forwardEstimate the equilibrium price. $ per pan. Round to the nearest dollar. Use the graph attached below to help answer the question i appreciate it thanks!!!!arrow_forward
- Your analysis of data indicates that the demand curve for product x is estimated to be linear and given by equation Qd = 150-3p and the supply curve for product x appears to be linear as well and is estimated Qs=P-10. Graphically draw these two curves labeling all relevant points such as intercepts for each line inn the horizonal and vertical axes. Now, given the demand is Qd=150-3P and supply is Qs=P-10 the next assignment is to compute the equillirbium price and quantity in the market for product X, indicate on a graph. changes in consumer demographics cause the demand curve to change Qd=90-3p. If the supply curve remains the same Qs = P - 10 graphically draw these two curves labeling all the relevant points in the horizontal and vertical axes. Now, given the demand is Qd = 90-3P and supply is Qs = P-10, the next task is to compute the new equilibrium price and quantity in the market for product x. Indicate on a graph.arrow_forwardKk135.arrow_forwardqs=-5+3p qd=9-2p2 Draw the market diagram for this product with price shown on the vertical axis. Find the economically meaningful solution for the equilibrium price and quantity.arrow_forward
arrow_back_ios
SEE MORE QUESTIONS
arrow_forward_ios
Recommended textbooks for you
 Principles of Economics (12th Edition)EconomicsISBN:9780134078779Author:Karl E. Case, Ray C. Fair, Sharon E. OsterPublisher:PEARSON
 Engineering Economy (17th Edition)EconomicsISBN:9780134870069Author:William G. Sullivan, Elin M. Wicks, C. Patrick KoellingPublisher:PEARSON
 Principles of Economics (MindTap Course List)EconomicsISBN:9781305585126Author:N. Gregory MankiwPublisher:Cengage Learning
 Managerial Economics: A Problem Solving ApproachEconomicsISBN:9781337106665Author:Luke M. Froeb, Brian T. McCann, Michael R. Ward, Mike ShorPublisher:Cengage Learning
 Managerial Economics & Business Strategy (Mcgraw-...EconomicsISBN:9781259290619Author:Michael Baye, Jeff PrincePublisher:McGraw-Hill Education
Principles of Economics (12th Edition)
Economics
ISBN:9780134078779
Author:Karl E. Case, Ray C. Fair, Sharon E. Oster
Publisher:PEARSON
Engineering Economy (17th Edition)
Economics
ISBN:9780134870069
Author:William G. Sullivan, Elin M. Wicks, C. Patrick Koelling
Publisher:PEARSON
Principles of Economics (MindTap Course List)
Economics
ISBN:9781305585126
Author:N. Gregory Mankiw
Publisher:Cengage Learning
Managerial Economics: A Problem Solving Approach
Economics
ISBN:9781337106665
Author:Luke M. Froeb, Brian T. McCann, Michael R. Ward, Mike Shor
Publisher:Cengage Learning
Managerial Economics & Business Strategy (Mcgraw-...
Economics
ISBN:9781259290619
Author:Michael Baye, Jeff Prince
Publisher:McGraw-Hill Education