
MATLAB: An Introduction with Applications
6th Edition
ISBN: 9781119256830
Author: Amos Gilat
Publisher: John Wiley & Sons Inc
expand_more
expand_more
format_list_bulleted
Related questions
Question
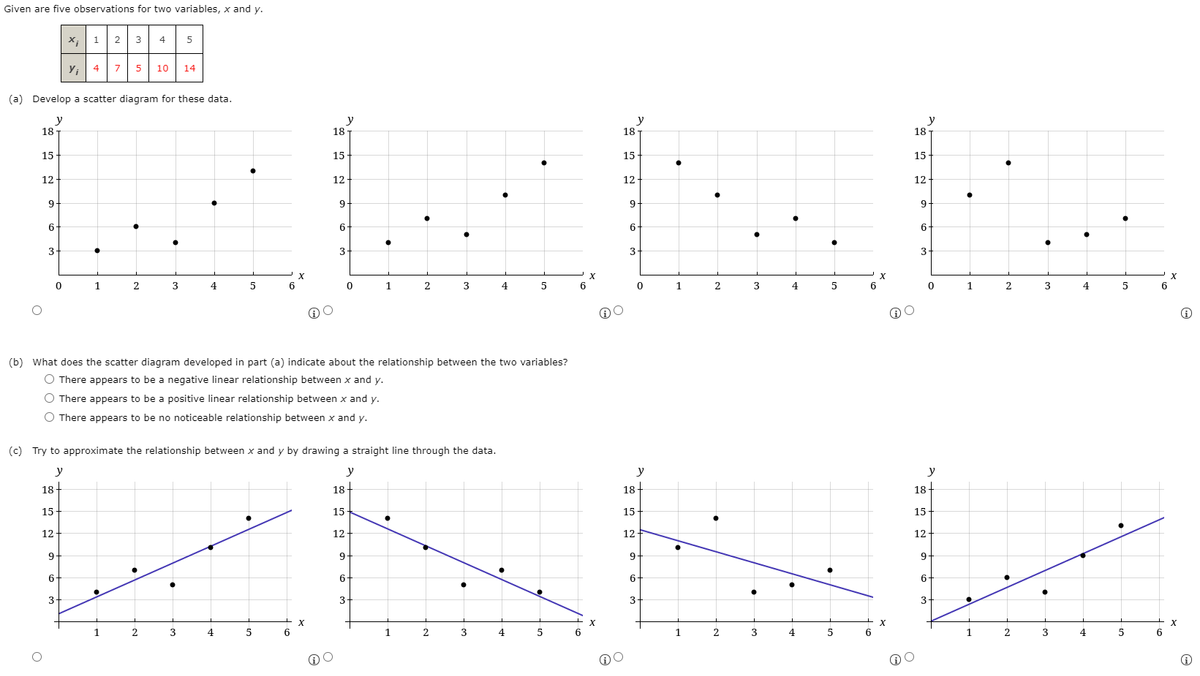

Transcribed Image Text:Given are five observations for two variables, x and y.
х, 1
2 3
5
4
y; 4
7 5
10 14
(a) Develop a scatter diagram for these data.
y
18
y
18
y
18
y
18
15
15
15
15
12
12
12
12
9
9
6
6.
6
6
3
3-
3
3
X
1.
2
3
4
5
6
3
4
6
4
2.
3
4
6
(b) What does the scatter diagram developed in part (a) indicate about the relationship between the two variables?
O There appears to be a negative linear relationship between x and y.
O There appears to be a positive linear relationship between x and y.
O There appears to be no noticeable relationship between x and y.
(c) Try to approximate the relationship between x and y by drawing a straight line through the data.
y
y
y
y
18-
18+
18+
18-
15
15
15-
15
12
12
12
12
9
9
9
9
6-
6-
6-
3
3
3
1
2
3
4
2
4
5
1
2
3
1.
2
3
4
5
6

Transcribed Image Text:(d) Develop the estimated regression equation by computing the values of b, and b, using b,
[(x, - x)(y, - Y)
and b, = y - b,x.
I(x, - x)2
(e) Use the estimated regression equation to predict the value of y when x = 4.
Expert Solution
This question has been solved!
Explore an expertly crafted, step-by-step solution for a thorough understanding of key concepts.

This is a popular solution

Trending nowThis is a popular solution!

Step by stepSolved in 2 steps

Knowledge Booster

Similar questions
- The data show the number of vacation days used by a sample of 20 employees in a recent year. Use technology to answer parts (a) and (b). a. Find the data set's first, second, and third quartiles. b. Draw a box-and-whisker plot that represents the data set. 1 5 4 3 6 0 5 3 4 5 3 1 10 7 8 6 1 2 89 a. Find the three quartiles. Q₁ = Q₂ = Q3 = (Type integers or decimals. Do not round.) b. Choose the correct answer plot below. Note that different technologies will produce slightly different results. O A. OB. Q Q C O C. Qarrow_forwardTrue or false. When drawing a scatter diagram, the explanatory variable is placed along the vertical axis.arrow_forwardI keep getting these wrong on my homework assignments please explainarrow_forward
- B) has more than one answer .. Thank youarrow_forwardWe will rank the y-values of the following data set: x y -1 0.6 -0.5 -5.2 1.7 6 2.6 7.2 3.2 11.6 5.1 15.3 6.7 7.7 8.8 17.1 9.4 22.4 10.1 13.8 Fill in the following table: x y x-rank y-rank -1 0.6 1 -0.5 -5.2 2 1.7 6 3 2.6 7.2 4 3.2 11.6 5 5.1 15.3 6 6.7 7.7 7 8.8 17.1 8 9.4 22.4 9 10.1 13.8 10arrow_forward5:23 Pulse = 101 of ... 3.00-3.79 3.80-4.59 4.60-5.39 5.40-6.19 6.20-6.99 Pulse > 11 5 3 0 1 Chosen classes can vary. Aa 34. Twenty-nine executives reported the number of telephone calls made during a randomly selected week as shown here. Construct a stem and leaf plot for the data and analyze the results. 22 14 12 14 12 9 54 9 54 12 16 12 12 14 49 10 14 8 21 37 28 36 22 9 33 58 31 41 19 3 18 25 28 52 35. The National Insurance Crime Bureau reported that these data represent the number of 51 Garrow_forward
- X, absences Y, final grade 4. The data below are the number of absences, x, and the final grades, y, of 9 randomly selected students from a MTH 119 class. Construct a scatterplot of the data. 0 99 4 58 7 51 5 82 9 71 geyerinstructional.com 3 92 16 55 1 5 76 5 82arrow_forward.The two data sets below represent the high temperatures in two citieseach day for 5 days.City A: 18°F, 44°F, 52°F, 55°F, 58°F, 56°FCity B: 15°F, 41°F, 63°F, 61°F, 57°F, 60°F Which statementbestdescribes the measure of center that provides themost accurate estimation of the high temperature in a day in each city? A.mean, because there is an even number of values in each data set B.median, because there is an even number of values in each data set C.mean, because there is one value in each data set that is significantlylower than the other values D.median, because there is one value in each data set that issignificantly lower than the other valuesarrow_forwardWe will rank the y-values of the following data set: x y 3 -7.5 4.3 6.5 4.9 -7.5 6.9 -0.1 8 4.8 9.2 -7.3 10.1 -3 10.8 2.5 11.9 -13.1 Fill in the following table: x y x-rank y-rank 3 -7.5 1 4.3 6.5 2 4.9 -7.5 3 6.9 -0.1 4 8 4.8 5 9.2 -7.3 6 10.1 -3 7 10.8 2.5 8 11.9 -13.1 9arrow_forward
arrow_back_ios
arrow_forward_ios
Recommended textbooks for you
- MATLAB: An Introduction with ApplicationsStatisticsISBN:9781119256830Author:Amos GilatPublisher:John Wiley & Sons Inc
 Probability and Statistics for Engineering and th...StatisticsISBN:9781305251809Author:Jay L. DevorePublisher:Cengage Learning
 Statistics for The Behavioral Sciences (MindTap C...StatisticsISBN:9781305504912Author:Frederick J Gravetter, Larry B. WallnauPublisher:Cengage Learning
  Elementary Statistics: Picturing the World (7th E...StatisticsISBN:9780134683416Author:Ron Larson, Betsy FarberPublisher:PEARSON
 The Basic Practice of StatisticsStatisticsISBN:9781319042578Author:David S. Moore, William I. Notz, Michael A. FlignerPublisher:W. H. Freeman
 Introduction to the Practice of StatisticsStatisticsISBN:9781319013387Author:David S. Moore, George P. McCabe, Bruce A. CraigPublisher:W. H. Freeman
MATLAB: An Introduction with Applications
Statistics
ISBN:9781119256830
Author:Amos Gilat
Publisher:John Wiley & Sons Inc
Probability and Statistics for Engineering and th...
Statistics
ISBN:9781305251809
Author:Jay L. Devore
Publisher:Cengage Learning
Statistics for The Behavioral Sciences (MindTap C...
Statistics
ISBN:9781305504912
Author:Frederick J Gravetter, Larry B. Wallnau
Publisher:Cengage Learning
Elementary Statistics: Picturing the World (7th E...
Statistics
ISBN:9780134683416
Author:Ron Larson, Betsy Farber
Publisher:PEARSON
The Basic Practice of Statistics
Statistics
ISBN:9781319042578
Author:David S. Moore, William I. Notz, Michael A. Fligner
Publisher:W. H. Freeman
Introduction to the Practice of Statistics
Statistics
ISBN:9781319013387
Author:David S. Moore, George P. McCabe, Bruce A. Craig
Publisher:W. H. Freeman