
A First Course in Probability (10th Edition)
10th Edition
ISBN: 9780134753119
Author: Sheldon Ross
Publisher: PEARSON
expand_more
expand_more
format_list_bulleted
Related questions
Question
Understanding Single Station Flood Frequency Analysis in Estimating Flood
For the flow dataset (42-years of annual flow values) described earlier: (a) fit the
data set on a normal probability paper and show computations in a tabular form, (b) fit the log-normal
distribution to this data set on a log-normal probability paper and show computations in a tabular form, (c) for
both of the fitted distributions, compute the 90% confidence limits for the fitted probability curves and also
show computations in a tabular form.
In each case as listed above predict the 100-year, 150-year, and 200-year floods and compare results and how
comparable are these results?

Transcribed Image Text:Analyse
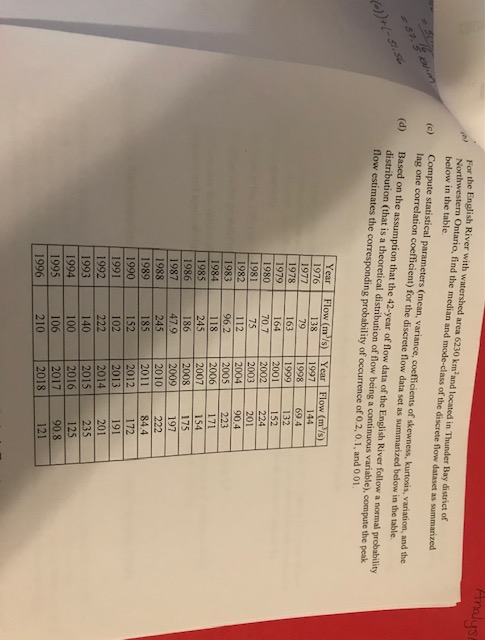
For the English River with watershed area 6230 km'and located in Thunder Bay district of
Northwestern Ontario, find the median and mode-class of the discrete flow dataset as summarized
below in the table
Compute statistical parameters (mean, variance, coefficients of skewness, kurtosis, variation, and the
lag one correlation coefficient) for the discrete flow data set as summarized below in the table
(c)
Based on the assumption that the 42-year of flow data of the English River follow a normal probability
distribution (that is a theoretical distribution of flow being a continuous variable), compute the peak
flow estimates the corresponding probability of occurrence of 0.2,0.1, and 0.01.
887
(d)
Year
Flow (m'/s) Year Flow (m'/s)
1976
1977
138
1997
1998
144
79
69.4
1978
163
164
70.7
1999
132
152
1979
2001
2002
1980
224
1981
1982
75
2003
112
96.2
201
90.4
223
2004
1983
2005
1984
1985
118
2006
171
245
2007
154
1986
186
2008
175
197
1987
47.9
2009
1988
245
2010
222
185
2011
84.4
172
1989
1990
152
2012
102
2013
2014
191
1991
1992
222
201
1993
140
2015
235
1994
100
2016
125
1995
106
2017
90.8
1996
210
2018
121
Expert Solution
This question has been solved!
Explore an expertly crafted, step-by-step solution for a thorough understanding of key concepts.

Step by stepSolved in 2 steps with 8 images

Knowledge Booster

Similar questions
- An engineer has built a simulation model of a small factory, run an experiment with the model using 15 replicates, and determined at 90% confidence that the mean time an entity spends in the system is in the range of 24 min to 28 min. The data are normally distributed. Based on this information, what can the engineer say about entity time-in-system?A -The population mean time-in-system must be in the interval 24 min to 28 min. B- The largest mean time-in-system for any one of the 15 replicates was 28 min. C- If the engineer were to run a 16th replicate, the mean time-in-system would be in the interval 24 min to 28 min. D. The probability that the population mean time-in-system is greater than 28 min can be estimated as 5%.arrow_forwardDefine what an endogenous variable is, describe three scenarios that may cause a problem of endogeneity, and what are minimal assumptions needed for a good instrument. Tobit models are used to model censored and corner solution data. Explain what the difference between these two types of data is, and how does it affect the interpretation of Tobit models? What is the difference between a logit and a probit model, and why would are they preferred over a linear probability model (LPM) Explain what it means for a variable to possess a unit root. What are the implications for regression analysis if one uses variables with Unit roots? Explain what serial correlation is, how do you test for it, and why it invalidates the standard calculation of standard errors in time series data. Describe what does it mean to have a spurious regression, why could it happen, and what are the consequences in terms of t-statistics and goodness of fit measures?arrow_forwardCalculate the F statisticarrow_forward
- tion w E Bb Collaborate - 2020 Fall Term + ed.cuny.edu/webapps/assessment/take/launch.jsp?course_assessment_id=_1729781_1&course_id%3 1968349 1&content id- 53765765 18step=null * Question Completion Status: QUESTION 1 A graphical display of a data set is given. Identify the overall shape of the distribution as (roughly) bell-shaped, triangular, uniform, reverse J-shaped, J-shaped, right skewed, left skewed, bimodal, or multimodal. 1 pc A relative frequency histogram for the sale prices of homes sold in one city during 2006 is shown below. Relative Frequency 0.35 0.30- 0,25 0.20 0.15 0.10 0.05 - 0.00 10 15 20 25 30 35 40 45 Sale price of home ($10,000s) Solution: Right skewed O J-shaped O Right skewed O Left skewed O Reverse J-shapedarrow_forwardOnly need help with question “b” and “c”arrow_forwardWhat type of distribution is appropriate to model the number of unsuccessful job applications until the first job offer. Binomial Normal Exponential Poisson Geometricarrow_forward
- Question 15arrow_forwardThe lifetime of a certain type of battery is normally distributed with mean value 11 hours and standard deviation 1 hour. There are nine batteries in a package. What lifetime value (in hours) is such that the total lifetime of all batteries in a package exceeds that value for only 5% of all packages? (Round your answer to two decimal places.) In USE SALT hoursarrow_forward
arrow_back_ios
arrow_forward_ios
Recommended textbooks for you
- A First Course in Probability (10th Edition)ProbabilityISBN:9780134753119Author:Sheldon RossPublisher:PEARSON

A First Course in Probability (10th Edition)
Probability
ISBN:9780134753119
Author:Sheldon Ross
Publisher:PEARSON