Concept explainers
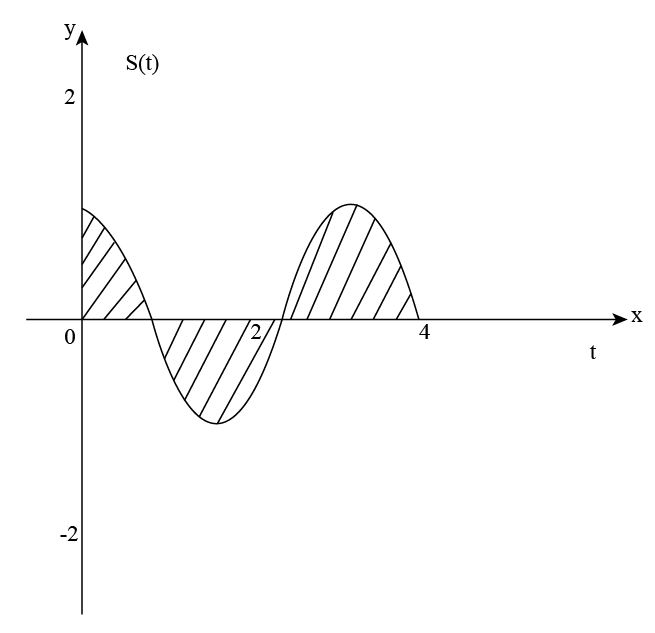
a) using the graph, on what days is the snow on the ground increasing?Decreasing? How do you know from the graph? ( Express in interval notation)
b) set up and evaluate a definite
c) what does the definite integral represent in the context of the problem?
d) if there was 6 inches of snow on the ground to begin, how much snow is there after 4 days?

The given graph is shown below.

From the graph, it can be seen that in the interval [0,-32] is decreasing , in is increasing and it is decreasing again. For . It implies that between ay 0 and daythe snowfall rate is decreasing and from day to day 3, this rate is increasing. From day 3, it is again decreasing and from day 4 and onwards, this rate becomes zero.
The given model representing the snowfall rate is given by
Hence,
Trending nowThis is a popular solution!
Step by stepSolved in 4 steps with 1 images

- A P-value can be positive or negative. can only range in value from -1 to 1. can be smaller than 0 but no larger than 1. can be larger than 1 but no smaller than 0. can be no smaller than 0 and no larger than 1.arrow_forwardplease give me the steps, in detail, on how to solve thisarrow_forwardCan you show me all the steps to answer this type of question?arrow_forward
 Advanced Engineering MathematicsAdvanced MathISBN:9780470458365Author:Erwin KreyszigPublisher:Wiley, John & Sons, Incorporated
 Numerical Methods for EngineersAdvanced MathISBN:9780073397924Author:Steven C. Chapra Dr., Raymond P. CanalePublisher:McGraw-Hill Education
 Introductory Mathematics for Engineering Applicat...Advanced MathISBN:9781118141809Author:Nathan KlingbeilPublisher:WILEY
 Mathematics For Machine TechnologyAdvanced MathISBN:9781337798310Author:Peterson, John.Publisher:Cengage Learning,


