
MATLAB: An Introduction with Applications
6th Edition
ISBN: 9781119256830
Author: Amos Gilat
Publisher: John Wiley & Sons Inc
expand_more
expand_more
format_list_bulleted
Related questions
Question
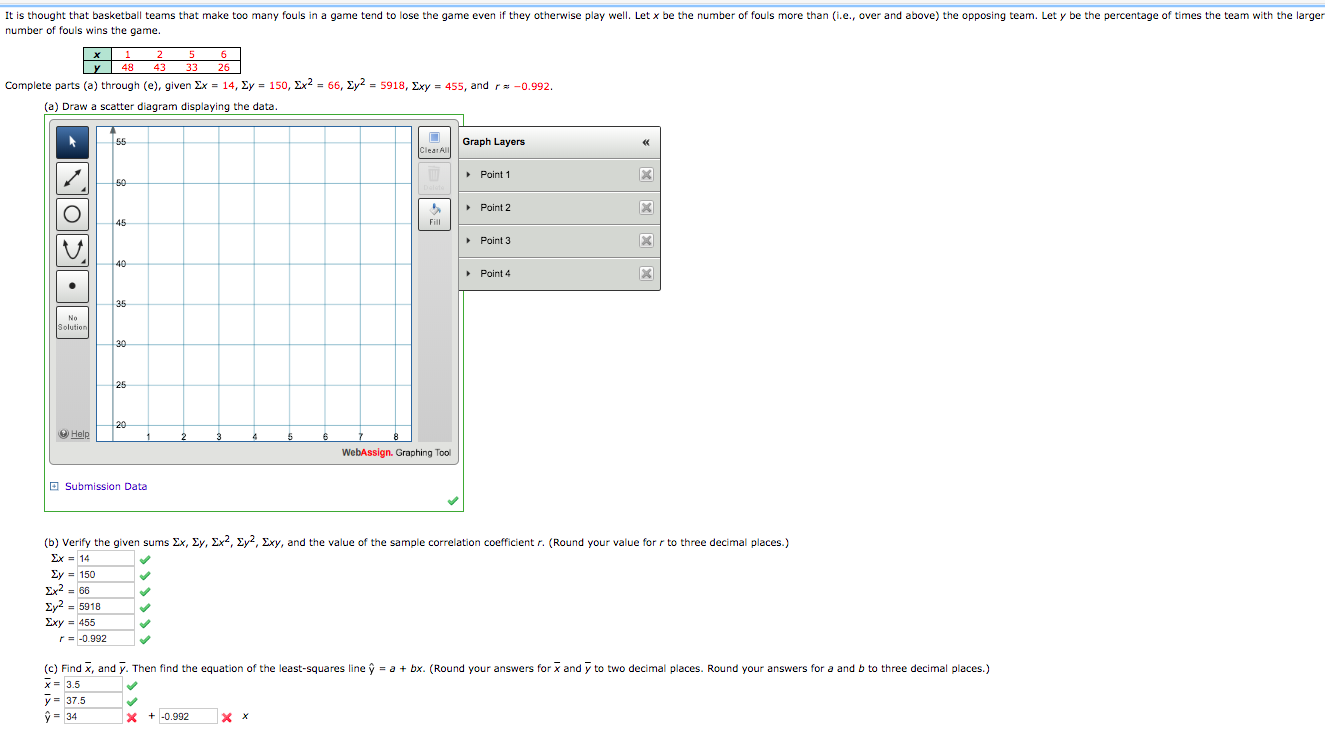

Transcribed Image Text:It is thought that basketball teams that make too many fouls in a game tend to lose the game even if they otherwise play well. Let x be the number of fouls more than (i.e., over and above) the opposing team. Let y be the percentage of times the team with the larger
number of fouls wins the game.
х
6.
|y 48
43
33
26
Complete parts (a) through (e), given Ex = 14, Ey = 150, Ex2 = 66, Ey2 = 5918, Exy = 455, and r= -0.992.
(a) Draw a scatter diagram displaying the data.
55
Graph Layers
Cleat All
• Point 1
50
• Point 2
45
Fill
• Point 3
40
• Point 4
35
No
Solution
30
25
20
O Help
WebAssign. Graphing Tool
O Submission Data
(b) Verify the given sums Ex, Ey, Ex2, Ey2, Exy, and the value of the sample correlation coefficient r. (Round your value for r to three decimal places.)
Ex = 14
Ey = 150
Ex = 66
Ey2 = 5918
Σγ2
Exy = 455
r= -0.992
(c) Find x, and y. Then find the equation of the least-squares line ŷ = a + bx. (Round your answers for x and y to two decimal places. Round your answers for a and b to three decimal places.)
X= 3.5
y = 37.5
ý = 34
X* + -0.992
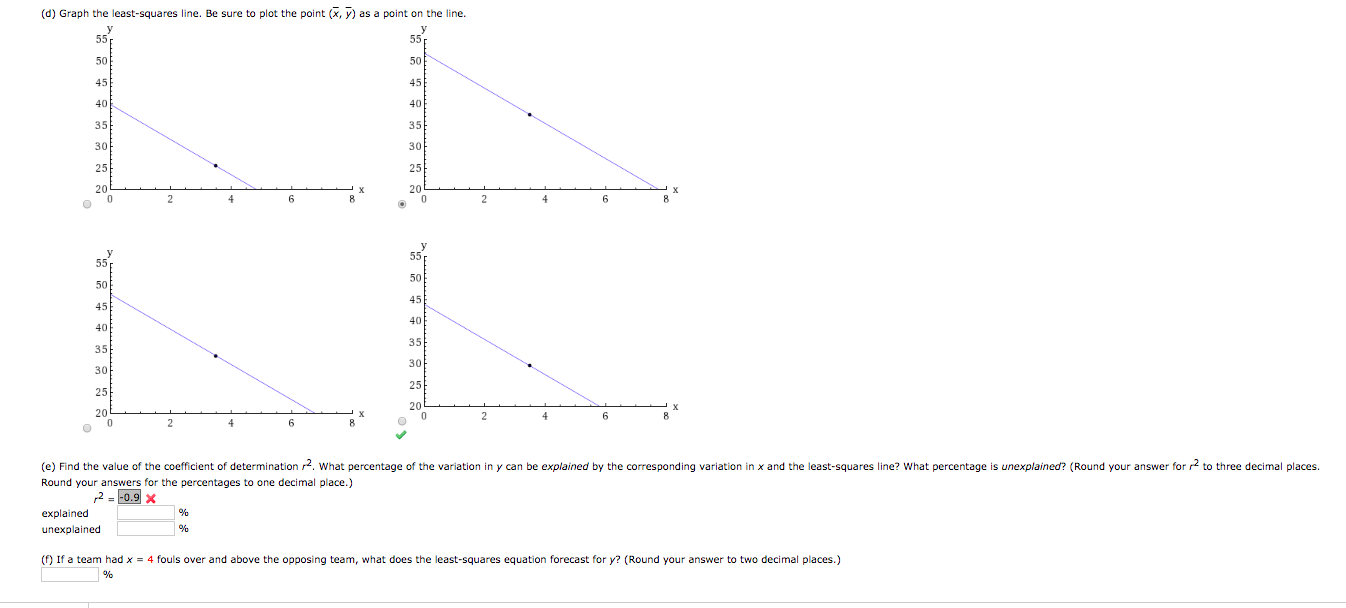
Transcribed Image Text:(d) Graph the least-squares line. Be sure to plot the point (x, y) as a point on the line.
y
55
55
50
50
45
45
40
40
35
35
30
30
25
25
20
х
20
2
4
8
4
55
55
50
50
45
45
40
40
35
35
30
30
25
25
20
х
8.
20
4
6.
6.
(e) Find the value of the coefficient of determination r2. What percentage of the variation in y can be explained by the corresponding variation in x and the least-squares line? What percentage is unexplained? (Round your answer for r2 to three decimal places.
Round your answers for the percentages to one decimal place.)
2 - -0.9 x
explained
unexplained
(f) If a team had x = 4 fouls over and above the opposing team, what does the least-squares equation forecast for y? (Round your answer to two decimal places.)
Expert Solution
This question has been solved!
Explore an expertly crafted, step-by-step solution for a thorough understanding of key concepts.

This is a popular solution

Trending nowThis is a popular solution!

Step by stepSolved in 3 steps with 4 images

Knowledge Booster

Similar questions
- Given the Information, find the equation for the least squares line as well as the correlation coefficient. (Round your values to two decimal places.) n= 10, 57, r-1,E-13, - 353, 45 -0.665x +3.8905 r0 53 Need Help? Read it Additional Materials Tech Guide Excel Tech Guide TI-83/84 OTech Guide THNspirearrow_forward2. The Mach number of a moving object is the ratio of its speedto the speed of sound. The following table shows the speeds of a jet aircraft, in terms of Mach numbers, and the time tafter it starts to accelerate. Find the least- squares line of s as a function of t. t(min) 0.00 s(Mach Number) 0.88 0.60 0.97 1.20 1.03 1.80 1.11 2.40 1.19 3.00 1.25arrow_forwardI'm not sure about this answer.arrow_forward
- A researcher want to know if there is a relationship between sleep and anxiety. The researcher randomly selected n = 5 participants and asked each to rate their sleep quality and anxiety level on a scale of 1 to 5. The data are below: Sleep X Anxiety Y 2 2 3 3 2 2 4 2 5 2 Calculate the Sum of Squares for X (SSX)arrow_forwardThe height (sidewalk to roof) of notable tall buildings in America is compared to the number of stories of the building (beginning at street level). Stories (x) Height (y) 56 1050 29 428 26 362 40 529 60 790 22 401 38 380 110 1454 100 1127 46 700 Calculate the least squares line. Put the equation in the form of: ý = a + bx. (Round your answers to three decimal places.) 86.7405 12.195arrow_forwardA motorist found that the efficiency of her engine could be increased by adding lubricating oil to fuel. She experimented with different amounts of lubricating oil and the data are Amount of lubricating oil (ml) Efficiency (%) 0 25 50 75 100 | 60 70 75 81 84 (a) Obtain the least squares fit of a straight line to the amount of lubricating oil. (b) Test whether or not the slope B, = 0. Take a = 0.05 as your level of significance. (c) Construct a 90% confidence interval on the mean response at xo = 10 ml.arrow_forward
arrow_back_ios
arrow_forward_ios
Recommended textbooks for you
- MATLAB: An Introduction with ApplicationsStatisticsISBN:9781119256830Author:Amos GilatPublisher:John Wiley & Sons Inc
 Probability and Statistics for Engineering and th...StatisticsISBN:9781305251809Author:Jay L. DevorePublisher:Cengage Learning
 Statistics for The Behavioral Sciences (MindTap C...StatisticsISBN:9781305504912Author:Frederick J Gravetter, Larry B. WallnauPublisher:Cengage Learning
  Elementary Statistics: Picturing the World (7th E...StatisticsISBN:9780134683416Author:Ron Larson, Betsy FarberPublisher:PEARSON
 The Basic Practice of StatisticsStatisticsISBN:9781319042578Author:David S. Moore, William I. Notz, Michael A. FlignerPublisher:W. H. Freeman
 Introduction to the Practice of StatisticsStatisticsISBN:9781319013387Author:David S. Moore, George P. McCabe, Bruce A. CraigPublisher:W. H. Freeman
MATLAB: An Introduction with Applications
Statistics
ISBN:9781119256830
Author:Amos Gilat
Publisher:John Wiley & Sons Inc
Probability and Statistics for Engineering and th...
Statistics
ISBN:9781305251809
Author:Jay L. Devore
Publisher:Cengage Learning
Statistics for The Behavioral Sciences (MindTap C...
Statistics
ISBN:9781305504912
Author:Frederick J Gravetter, Larry B. Wallnau
Publisher:Cengage Learning
Elementary Statistics: Picturing the World (7th E...
Statistics
ISBN:9780134683416
Author:Ron Larson, Betsy Farber
Publisher:PEARSON
The Basic Practice of Statistics
Statistics
ISBN:9781319042578
Author:David S. Moore, William I. Notz, Michael A. Fligner
Publisher:W. H. Freeman
Introduction to the Practice of Statistics
Statistics
ISBN:9781319013387
Author:David S. Moore, George P. McCabe, Bruce A. Craig
Publisher:W. H. Freeman