
MATLAB: An Introduction with Applications
6th Edition
ISBN: 9781119256830
Author: Amos Gilat
Publisher: John Wiley & Sons Inc
expand_more
expand_more
format_list_bulleted
Related questions
Question
Please number the response

Transcribed Image Text:4:44 O *
OX G l 86%
K Title
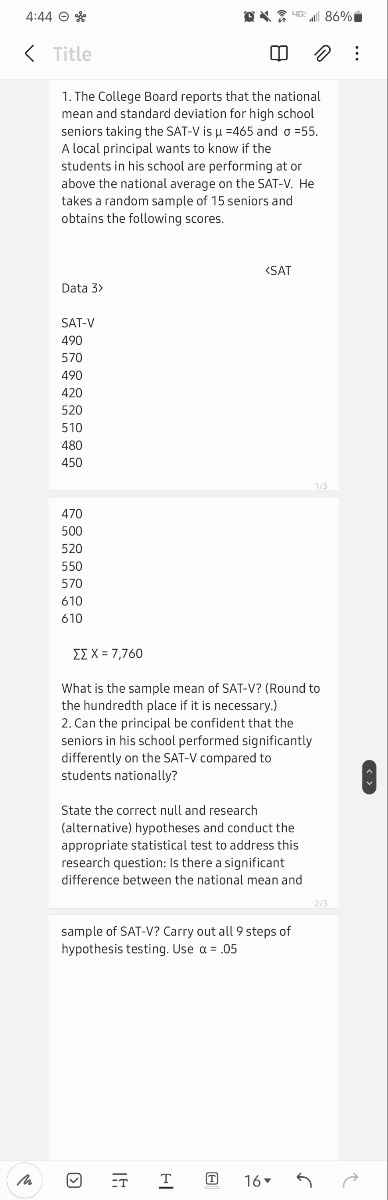
1. The College Board reports that the national
mean and standard deviation for high school
seniors taking the SAT-V is u =465 and o =55.
A local principal wants to know if the
students in his school are performing at or
above the national average on the SAT-V. He
takes a random sample of 15 seniors and
obtains the following scores.
(SAT
Data 3>
SAT-V
490
570
490
420
520
510
480
450
1/3
470
500
520
550
570
610
610
ΣΣΧ 7,760
What is the sample mean of SAT-V? (Round to
the hundredth place if it is necessary.)
2. Can the principal be confident that the
seniors in his school performed significantly
differently on the SAT-V compared to
students nationally?
State the correct null and research
(alternative) hypotheses and conduct the
appropriate statistical test to address this
research question: Is there a significant
difference between the national mean and
2/3
sample of SAT-V? Carry out all 9 steps of
hypothesis testing. Use a = ,05
-T
16.

Transcribed Image Text:t Table
Cum. prol
two-tail
0.10
0.05
0.01
di
6.314
12.71
63.66
2.920
4.303
9.925
3
2.353
3.182
5.841
4
2.132
2.776
4.604
5
2.015
2.571
4.032
6.
1.943
2.447
3.707
1.895
2.365
3.499
8
3.355
3.250
1.860
2.306
1.833
2.262
10
1.812
2.228
3.169
1.796
2.201
3.106
12
1.782
2.179
3.055
13
1.771
2.160
3.012
14
1.761
2.145
2.977
15
1.753
2.131
2.947
16
1.746
2.120
2.921
17
1.740
2.110
2.898
18
1.734
2.101
2.878
19
1.729
2.093
2.861
20
1.725
2.086
2.845
21
1.721
2.080
2.831
22
1.717
2.074
2.819
23
1.714
2.069
2.807
24
1.711
2.064
2.797
25
1.708
2.060
2.787
26
1.706
2.056
2.779
27
1.703
2.052
2.771
28
1.701
2.048
2.763
29
1.699
2.045
2.756
30
1.697
2.042
2.750
32
1.694
2.037
2.738
34
1.691
2.032
2.728
36
1.688
2.028
2.719
38
1.696
2.024
2.712
2.704
40
1.684
2.021
42
1.682
2.018
2.698
44
1.680
2.015
2.692
46
1.679
2.013
2.687
48
1.677
2.011
2.682
50
1.676
2.009
2.678
60
1.671
2.000
2.660
80
1.664
1.990
2.639
100
1.660
1.984
2.626
120
1.658
1.980
2.617
1000
1.646
1.962
2.581
1.645
1.960
2.576
90%
95%
99%
Confidence Level
Summary of the 9 Steps for Hypothesis Testing
1. Null and alternative hypothesis.
2. Two-tailed test.
3. Select a significant level alpha.
4. Determine T test OR Z test.
5. Teri OR Zerit (Draw a graph)
6. Calculate Tohy or Zye.
7. Check whether the observed value (obt) falls in the critical
region.
8. Reject or Fail to Reject Null Hypothesis.
9. Therefore, there isa statisticallysignificantdifference
between the sample mean and the population mean OR
there is no significant difference between the two means.
Expert Solution
This question has been solved!
Explore an expertly crafted, step-by-step solution for a thorough understanding of key concepts.

This is a popular solution

Trending nowThis is a popular solution!

Step by stepSolved in 2 steps with 2 images

Follow-up Questions
Read through expert solutions to related follow-up questions below.
Follow-up Question
it is actually 7780 not 7760 can we fix it fast please?
Solution
by Bartleby Expert
Follow-up Questions
Read through expert solutions to related follow-up questions below.
Follow-up Question
it is actually 7780 not 7760 can we fix it fast please?
Solution
by Bartleby Expert
Knowledge Booster

Similar questions
arrow_back_ios
arrow_forward_ios
Recommended textbooks for you
- MATLAB: An Introduction with ApplicationsStatisticsISBN:9781119256830Author:Amos GilatPublisher:John Wiley & Sons Inc
 Probability and Statistics for Engineering and th...StatisticsISBN:9781305251809Author:Jay L. DevorePublisher:Cengage Learning
 Statistics for The Behavioral Sciences (MindTap C...StatisticsISBN:9781305504912Author:Frederick J Gravetter, Larry B. WallnauPublisher:Cengage Learning
  Elementary Statistics: Picturing the World (7th E...StatisticsISBN:9780134683416Author:Ron Larson, Betsy FarberPublisher:PEARSON
 The Basic Practice of StatisticsStatisticsISBN:9781319042578Author:David S. Moore, William I. Notz, Michael A. FlignerPublisher:W. H. Freeman
 Introduction to the Practice of StatisticsStatisticsISBN:9781319013387Author:David S. Moore, George P. McCabe, Bruce A. CraigPublisher:W. H. Freeman
MATLAB: An Introduction with Applications
Statistics
ISBN:9781119256830
Author:Amos Gilat
Publisher:John Wiley & Sons Inc
Probability and Statistics for Engineering and th...
Statistics
ISBN:9781305251809
Author:Jay L. Devore
Publisher:Cengage Learning
Statistics for The Behavioral Sciences (MindTap C...
Statistics
ISBN:9781305504912
Author:Frederick J Gravetter, Larry B. Wallnau
Publisher:Cengage Learning
Elementary Statistics: Picturing the World (7th E...
Statistics
ISBN:9780134683416
Author:Ron Larson, Betsy Farber
Publisher:PEARSON
The Basic Practice of Statistics
Statistics
ISBN:9781319042578
Author:David S. Moore, William I. Notz, Michael A. Fligner
Publisher:W. H. Freeman
Introduction to the Practice of Statistics
Statistics
ISBN:9781319013387
Author:David S. Moore, George P. McCabe, Bruce A. Craig
Publisher:W. H. Freeman