MATLAB: An Introduction with Applications
6th Edition
ISBN: 9781119256830
Author: Amos Gilat
Publisher: John Wiley & Sons Inc
expand_more
expand_more
format_list_bulleted
Question
thumb_up100%

Transcribed Image Text:is μ =
d dev
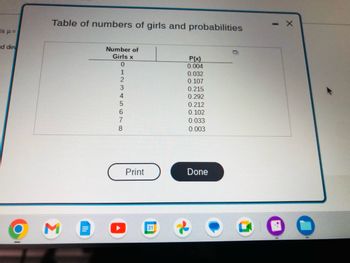
Table of numbers of girls and probabilities
3
Number of
Girls x
0
12345678
Print
31
P(x)
0.004
0.032
0.107
0.215
0.292
0.212
0.102
0.033
0.003
Done

Transcribed Image Text:Refer to the accompanying table, which describes results from groups of 8 births from 8 different sets of parents. The random variable x represents the number of girls among 8
children. Find the mean and standard deviation for the number of girls in 8 births.
Click the icon to view the data table.
The mean is μ = girl(s). (Round to one decimal place as needed.)
The standard deviation is o = girl(s). (Round to one decimal place as needed.)
Expert Solution
This question has been solved!
Explore an expertly crafted, step-by-step solution for a thorough understanding of key concepts.
Step by stepSolved in 2 steps with 2 images

Knowledge Booster
Similar questions
- Refer to the accompanying table, which describes results from groups of 8 births from 8 different sets of parents. The random variable x represents the number of girls among 8 children. Find the mean and standard deviation for the number of girls in 8 births. Click the icon to view the data table. The mean is µ = girl(s). (Round to one decimal place as needed.) Table of numbers of girls and probabilities Number of Girls x P(x) 0.006 1 0.031 2 0.114 3 0.212 4 0.266 0.224 0.115 7 0.029 8. 0.003 Print Donearrow_forward6arrow_forward6789SAWNI 2 4 5 10 11 12 261723 6,2 1, 5, 2, 7 A 7,8,4 2,5 3,6 6 where 7 | 2 = 72 students Calculate the mean of the data. Mean = 42.5 Mean = 45.5 Mean = 48 Mean=84arrow_forward
- A sample of 3 measurements are taken and recorded: a =8, y = 10 and z = 7 The sample mean is: x = = 8.33 Fill in the table below. aj (a; - x)2 Ex: 5.34 Ex: 5.34 Ex: 5.34 82 = (z-z)*+(y-a)* +(z-z) Ex: 5.34 (z-2)*+(y-z)* +(z-) = Ex: 5.34arrow_forwardA sample of eight math SAT scores is given below: 650,650,520,680,600,740,610,570 Find the first and third quartiles and the interquartile range for this sample. First Quartile = Third Quartile = Interquartile Range = Hint You should be using the formula Lp=p/100×(n+1)Lp=p/100×(n+1).arrow_forwardFind the probability that the sample mean of Xbar = 20 hours, as observed here, less than or equal 20 hours could arise if the true mean of the lotarrow_forward
- The average daily high temperature in degrees Celsius (C) during the month of July was recorded for the 51 largest cities in the United States. Summary measures are shown below. Mean 30.84 Standard Deviation 3.78 Median IQR 31 5 Range 22 Which of the following represents the median and interquartile range (IQR) of these average daily high temperatures in degrees Fahrenheit (F), where F = (3) C + 32? (A) Median = 52.8°F, IQR = 9°F (B) Median = 52.8°F, IQR = 41°F (C) Median 87.8°F, IQR = 5°F (D) Median = 87.8°F, IQR = 9°F (E) Median 87.8°F, IQR = 41°Farrow_forwardA researcher is curious about the average IQ of registered voters in the state of Florida. If this average could be obtained, it would be an example of a (a) parameter (b) population (c) sample (d) statistic (e) None of the abovearrow_forwardAn experiment was conducted in which two fair dice were thrown 100 times. The sum of the pips showing on the dice was then recorded. The frequency histogram to the right gives the results. Use the histogram to complete parts (a) through (f). (a) What was the most frequent outcome of the experiment? Frequency 20- -N 2 Sum of Two Dice -to -ra 6 8 Value of dice 10 12 Q 17arrow_forward
arrow_back_ios
SEE MORE QUESTIONS
arrow_forward_ios
Recommended textbooks for you
 MATLAB: An Introduction with ApplicationsStatisticsISBN:9781119256830Author:Amos GilatPublisher:John Wiley & Sons Inc
 Probability and Statistics for Engineering and th...StatisticsISBN:9781305251809Author:Jay L. DevorePublisher:Cengage Learning
 Statistics for The Behavioral Sciences (MindTap C...StatisticsISBN:9781305504912Author:Frederick J Gravetter, Larry B. WallnauPublisher:Cengage Learning
 Elementary Statistics: Picturing the World (7th E...StatisticsISBN:9780134683416Author:Ron Larson, Betsy FarberPublisher:PEARSON
 The Basic Practice of StatisticsStatisticsISBN:9781319042578Author:David S. Moore, William I. Notz, Michael A. FlignerPublisher:W. H. Freeman
 Introduction to the Practice of StatisticsStatisticsISBN:9781319013387Author:David S. Moore, George P. McCabe, Bruce A. CraigPublisher:W. H. Freeman

MATLAB: An Introduction with Applications
Statistics
ISBN:9781119256830
Author:Amos Gilat
Publisher:John Wiley & Sons Inc

Probability and Statistics for Engineering and th...
Statistics
ISBN:9781305251809
Author:Jay L. Devore
Publisher:Cengage Learning

Statistics for The Behavioral Sciences (MindTap C...
Statistics
ISBN:9781305504912
Author:Frederick J Gravetter, Larry B. Wallnau
Publisher:Cengage Learning

Elementary Statistics: Picturing the World (7th E...
Statistics
ISBN:9780134683416
Author:Ron Larson, Betsy Farber
Publisher:PEARSON

The Basic Practice of Statistics
Statistics
ISBN:9781319042578
Author:David S. Moore, William I. Notz, Michael A. Fligner
Publisher:W. H. Freeman

Introduction to the Practice of Statistics
Statistics
ISBN:9781319013387
Author:David S. Moore, George P. McCabe, Bruce A. Craig
Publisher:W. H. Freeman