
MATLAB: An Introduction with Applications
6th Edition
ISBN: 9781119256830
Author: Amos Gilat
Publisher: John Wiley & Sons Inc
expand_more
expand_more
format_list_bulleted
Related questions
Topic Video
Question
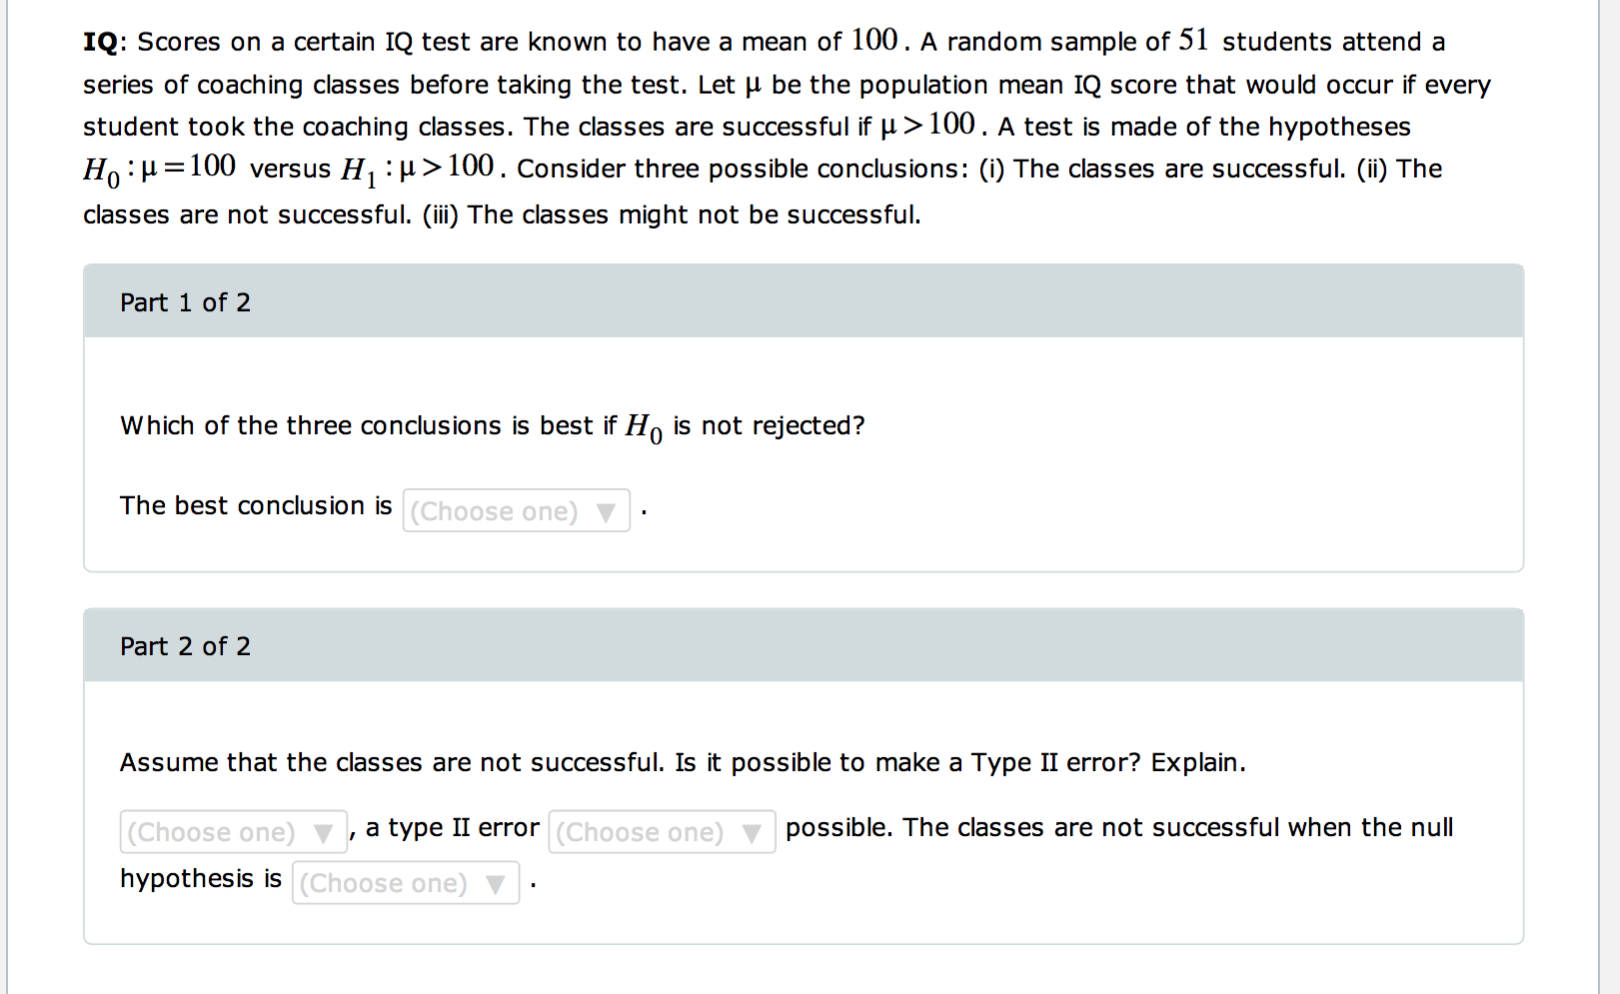

Transcribed Image Text:IQ: Scores on a certain IQ test are known to have a mean of 100. A random sample of 51 students attend a
series of coaching classes before taking the test. Let µ be the population mean IQ score that would occur if every
student took the coaching classes. The classes are successful if µ>100. A test is made of the hypotheses
Ho:H=100 versus H, :µ>100. Consider three possible conclusions: (i) The classes are successful. (ii) The
classes are not successful. (ii The classes might not be successful.
Part 1 of 2
Which of the three conclusions is best if H, is not rejected?
The best conclusion is (Choose one) ▼
Part 2 of 2
Assume that the classes are not successful. Is it possible to make a Type II error? Explain.
a type II error (Choose one)
(Choose one)
hypothesis is (Choose one) ▼
possible. The classes are not successful when the null
Expert Solution
This question has been solved!
Explore an expertly crafted, step-by-step solution for a thorough understanding of key concepts.

This is a popular solution

Trending nowThis is a popular solution!

Step by stepSolved in 2 steps

Knowledge Booster


Learn more about
Need a deep-dive on the concept behind this application? Look no further. Learn more about this topic, statistics and related others by exploring similar questions and additional content below.Similar questions
- A personality test has a subsection designed to assess the "honesty" of the test-taker. Suppose that you're interested in the mean score, µ, on this subsection among the general population. You decide that you'll use the mean of a random sample of scores on this subsection to estimate u. What is the minimum sample size needed in order for you to be 90% confident that your estimate is within 3 of u? Use the value 23 for the population standard deviation of scores on this subsection. Carry your intermediate computations to at least three decimal places. Write your answer as a whole number (and make sure that it is the minimum whole number that satisfies the requirements). (If necessary, consult a list of formulas.)arrow_forward1) Your instructor tells you that past average scores for the final exam are 75%. But this semester he has been using online quizzes to help your class better prepare for the final. Your class scored the following on the final exam: mean= 80% with a 10% standard deviation. There are 49 people in your class. Using a one-sample t test, what is your t score for this class? Assuming α = .05, did the online quizzes help your class perform better?arrow_forwardAn IQ test is designed so that the mean is 100 and the standard deviation is 23 for the population of normal adults. Find the sample size necessary to estimate the mean IQ score of statistics students such that it can be said with 90% confidence that the sample mean is within 8 IQ points of the true mean. Assume that o = 23 and determine the required sample size using technology. Then determine if this is a reasonable sample size for a real world calculation. The required sample size is (Round up to the nearest integer.)arrow_forward
- A random sample of n1 = 49 measurements from a population with population standard deviation ?1 = 3 had a sample mean of x1 = 9. An independent random sample of n2 = 64 measurements from a second population with population standard deviation ?2 = 4 had a sample mean of x2 = 11. Test the claim that the population means are different. Use level of significance 0.01.arrow_forwardplease check this. The recidivism rate for convicted sex offenders is 14%. A warden suspects that this percent is different if the sex offender is also a drug addict. Of the 324 convicted sex offenders who were also drug addicts, 32 of them became repeat offenders. What can be concluded at the αα = 0.05 level of significance? For this study, we should use The null and alternative hypotheses would be: Ho: (please enter a decimal) H1: (Please enter a decimal) The test statistic = (please show your answer to 3 decimal places.) The p-value = (Please show your answer to 4 decimal places.) The p-value is αα Based on this, we should the null hypothesis. Thus, the final conclusion is that ... The data suggest the populaton proportion is significantly different from 14% at αα = 0.05, so there is statistically significant evidence to conclude that the population proportion of convicted sex offender drug addicts who become repeat offenders…arrow_forwardYou are conducting a study to see if the accuracy rate for fingerprint identification is significantly different from 0.51. Thus you are performing a two-tailed test. Your sample data produce the test statistic - 2.153. Find the p-value accurate to Z = - 4 decimal places. p-valuearrow_forward
arrow_back_ios
arrow_forward_ios
Recommended textbooks for you
- MATLAB: An Introduction with ApplicationsStatisticsISBN:9781119256830Author:Amos GilatPublisher:John Wiley & Sons Inc
 Probability and Statistics for Engineering and th...StatisticsISBN:9781305251809Author:Jay L. DevorePublisher:Cengage Learning
 Statistics for The Behavioral Sciences (MindTap C...StatisticsISBN:9781305504912Author:Frederick J Gravetter, Larry B. WallnauPublisher:Cengage Learning
  Elementary Statistics: Picturing the World (7th E...StatisticsISBN:9780134683416Author:Ron Larson, Betsy FarberPublisher:PEARSON
 The Basic Practice of StatisticsStatisticsISBN:9781319042578Author:David S. Moore, William I. Notz, Michael A. FlignerPublisher:W. H. Freeman
 Introduction to the Practice of StatisticsStatisticsISBN:9781319013387Author:David S. Moore, George P. McCabe, Bruce A. CraigPublisher:W. H. Freeman
MATLAB: An Introduction with Applications
Statistics
ISBN:9781119256830
Author:Amos Gilat
Publisher:John Wiley & Sons Inc
Probability and Statistics for Engineering and th...
Statistics
ISBN:9781305251809
Author:Jay L. Devore
Publisher:Cengage Learning
Statistics for The Behavioral Sciences (MindTap C...
Statistics
ISBN:9781305504912
Author:Frederick J Gravetter, Larry B. Wallnau
Publisher:Cengage Learning
Elementary Statistics: Picturing the World (7th E...
Statistics
ISBN:9780134683416
Author:Ron Larson, Betsy Farber
Publisher:PEARSON
The Basic Practice of Statistics
Statistics
ISBN:9781319042578
Author:David S. Moore, William I. Notz, Michael A. Fligner
Publisher:W. H. Freeman
Introduction to the Practice of Statistics
Statistics
ISBN:9781319013387
Author:David S. Moore, George P. McCabe, Bruce A. Craig
Publisher:W. H. Freeman