
MATLAB: An Introduction with Applications
6th Edition
ISBN: 9781119256830
Author: Amos Gilat
Publisher: John Wiley & Sons Inc
expand_more
expand_more
format_list_bulleted
Related questions
Concept explainers
Topic Video
Question
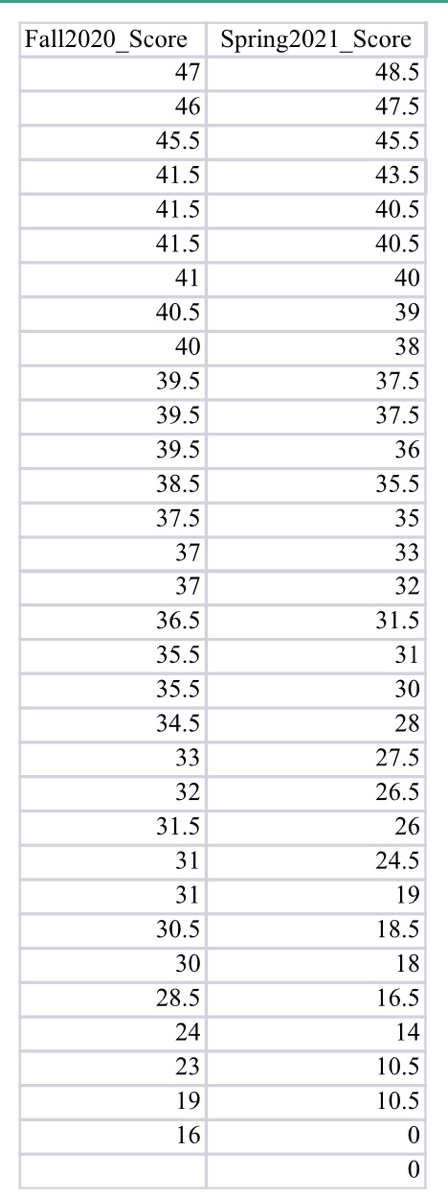

Transcribed Image Text:Fall2020 Score
Spring2021_Score
47
48.5
46
47.5
45.5
45.5
41.5
43.5
41.5
40.5
41.5
40.5
41
40
40.5
39
40
38
39.5
37.5
39.5
37.5
39.5
36
38.5
35.5
37.5
35
37
33
37
32
36.5
31.5
35.5
31
35.5
30
34.5
28
33
27.5
32
26.5
31.5
26
31
24.5
31
19
30.5
18.5
30
18
28.5
16.5
24
14
23
10.5
19
10.5
16

Transcribed Image Text:Investigation Background: For this investigation you will be comparing the Exam 1 scores
between two populations. The first population will be students from all of my sections from my
Fall 2020 Math 140 class. The second population will be students from all of my sections from
my Spring 2021 Math140 class. The data set you are provided with contains two columns. The
first column, Fall2020 Score, contains the Exam 1 scores from Fall 2020 Math140-1146. The
second column, Spring2021_Score, contains the scores from your class: Spring 2021 Math140-
1146. Our goal is to determine whether there is a difference in the mean scores of Exam1 from
Fall 2020 and Spring 2021.
Based on the P-value that you obtained in part d of section 3, do you reject or fail to
reject the null hypothesis? Explain your reasoning.
a.
b. In the context of the investigation, interpret your answer from section 4 part a.
Expert Solution
This question has been solved!
Explore an expertly crafted, step-by-step solution for a thorough understanding of key concepts.

Step by stepSolved in 2 steps with 2 images

Knowledge Booster


Learn more about
Need a deep-dive on the concept behind this application? Look no further. Learn more about this topic, statistics and related others by exploring similar questions and additional content below.Similar questions
- why do you think the data presented this way?arrow_forwardPlease complete the following question. Make sure you are responding to all parts of the question. The number of awards earned by students at one high school is recorded. Predictors of the number of awards earned include the type of program in which the student was enrolled (e.g., vocational, general or academic) and the score on their final exam in math. Variables Participant number (ID) Number of awards Program type (vocational - 1; general - 2; academic - 3 Math Score id num_awards prog math 45 1 3 41 108 1 1 41 15 1 3 44 67 1 3 42 153 1 3 40 51 1 1 42 164 1 3 46 133 1 3 40 2 1 3 33 53 1 3 46 1 1 3 40 128 0 2 38 16 1 3 44 106 1 3 37 89 1 3 40 134 1 1 39 19 1 1 43 145 0 3 38 11 1 2 45 117 0 3 39 109 1 1 42 12 1 3 45 37 1 3 40 69 0 3 40 43 1 2 43…arrow_forwardSee picturearrow_forward
- How can graphics and/or statistics be used to misrepresent data?arrow_forwardPut these steps for the process of statistics in the correct order.arrow_forwardWhat percentage of data would you predict would be between 25 and 50 and what percentage would you predict would be more than 50 miles? Use the Week 4 spreadsheet again to find the percentage of the data set we expect to have values between 25 and 50 as well as for more than 50. Now determine the percentage of data points in the dataset that fall within each of these ranges, using same strategy as above for counting data points in the data set. How do each of these compare with your prediction and why is there a difference? Predicted percentage between 25 and 50: ________________________ Actual percentage: Predicted percentage more than 50 miles: Actual percentage: ___________________________________________ Comparison ____________________________________________________ Why? __________________________________________________________ Drive: 44 20 88 6 71 42 76 63 61 63 84 28 55 33 88 80 86 83 5 85 25 25 54 54 81 73 29 76 78…arrow_forward
- All Greens is a franchise store that sells house plants and lawn and garden supplies. Although All Greens is a franchise, each store is owned and managed by private individuals. Some friends have asked you to go into business with them to open a new All Greens store in the suburbs of San Diego. The national franchise headquarters sent you the following information at your request. These data are about 27 All Greens stores in California. Each of the 27 stores has been doing very well, and you would like to use the information to help set up your own new store. The variables for which we have data are detailed below. x1 = annual net sales, in thousands of dollarsx2 = number of square feet of floor display in store, in thousands of square feetx3 = value of store inventory, in thousands of dollarsx4 = amount spent on local advertising, in thousands of dollarsx5 = size of sales district, in thousands of familiesx6 = number of competing or similar stores in sales district A sales district…arrow_forwardYou are the Provost of a University and you want to see if students would like to participate in classroom-based physical activity. You implemented a quick pilot test and collected data after Spring quarter. Below is the first set of data. Based on the data, answer the question. Age (1-18-24 Participant Height (inches) Weight (pounds) Sex (1= male, 2 = female) Ever participated in classroom exercise (1= No, 2 = Yes) years, 2=25-34 years, 3 35-49 years, 4 50 years or older) 1 66 150 1 1 1 2 72 150 2 2 4 3 66 150 2 1 2 4 74 215 1 2 1 5 66 112 2 2 6 71 215 2 2 7 69 175 2 2 3 8 66 152 2 1 9 72 375 1 10 66 140 1 2 What type of variable is sex and age? dichotomous, ordinal dichotomous, nominal O nominal, discrete nominal, dichotomousarrow_forwardProvide a reason why the classification of data is important.arrow_forward
- How would you "describe the population in this study? (Including the population size)arrow_forwardWhen manually calculating a Mann-Whitney analysis, the first step is to organize your data in numerical order, from lowest to highest. Which of the following statements is true about this step in the analysis process. Group of answer choices The data should be squared before you sum the data. The data from both groups should be combined before ranking the data. The data should be summed (added) before ranking the data. The data should be ranked with each group independently.arrow_forwardFor each vignette, choose the type of research that is being conducted. There is only one correct answer for each vignette. Here are your answer choices for questions 1-18 Case Study Naturalistic Observation Laboratory Observation Survey Correlation Test Experiment Longitudinal Design Cross Section Cross Sequential Design Maria wants to understand the political demographics in her community, so she creates a questionnaire asking people to identify their age, gender, political affiliation, religion and marital status. After Maria collects the abovementioned data (in question #12), she then identifies the relationships between religion and political affiliation. Kathi…arrow_forward
arrow_back_ios
SEE MORE QUESTIONS
arrow_forward_ios
Recommended textbooks for you
- MATLAB: An Introduction with ApplicationsStatisticsISBN:9781119256830Author:Amos GilatPublisher:John Wiley & Sons Inc
 Probability and Statistics for Engineering and th...StatisticsISBN:9781305251809Author:Jay L. DevorePublisher:Cengage Learning
 Statistics for The Behavioral Sciences (MindTap C...StatisticsISBN:9781305504912Author:Frederick J Gravetter, Larry B. WallnauPublisher:Cengage Learning
  Elementary Statistics: Picturing the World (7th E...StatisticsISBN:9780134683416Author:Ron Larson, Betsy FarberPublisher:PEARSON
 The Basic Practice of StatisticsStatisticsISBN:9781319042578Author:David S. Moore, William I. Notz, Michael A. FlignerPublisher:W. H. Freeman
 Introduction to the Practice of StatisticsStatisticsISBN:9781319013387Author:David S. Moore, George P. McCabe, Bruce A. CraigPublisher:W. H. Freeman
MATLAB: An Introduction with Applications
Statistics
ISBN:9781119256830
Author:Amos Gilat
Publisher:John Wiley & Sons Inc
Probability and Statistics for Engineering and th...
Statistics
ISBN:9781305251809
Author:Jay L. Devore
Publisher:Cengage Learning
Statistics for The Behavioral Sciences (MindTap C...
Statistics
ISBN:9781305504912
Author:Frederick J Gravetter, Larry B. Wallnau
Publisher:Cengage Learning
Elementary Statistics: Picturing the World (7th E...
Statistics
ISBN:9780134683416
Author:Ron Larson, Betsy Farber
Publisher:PEARSON
The Basic Practice of Statistics
Statistics
ISBN:9781319042578
Author:David S. Moore, William I. Notz, Michael A. Fligner
Publisher:W. H. Freeman
Introduction to the Practice of Statistics
Statistics
ISBN:9781319013387
Author:David S. Moore, George P. McCabe, Bruce A. Craig
Publisher:W. H. Freeman