A First Course in Probability (10th Edition)
10th Edition
ISBN: 9780134753119
Author: Sheldon Ross
Publisher: PEARSON
expand_more
expand_more
format_list_bulleted
Question

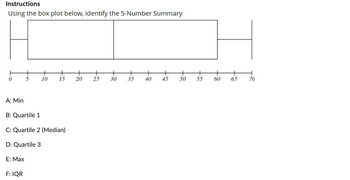
Transcribed Image Text:Instructions
Using the box plot below, identify the 5-Number Summary
+
+
+
+
+
+
+
+
+
+
5
10
15
20
25
30
35
40
45 50
55
60
65 70
5
A: Min
B: Quartile 1
C: Quartile 2 (Median)
D: Quartile 3
E: Max
F: IQR
Expert Solution
This question has been solved!
Explore an expertly crafted, step-by-step solution for a thorough understanding of key concepts.
Step by stepSolved in 2 steps with 1 images

Knowledge Booster
Similar questions
- Use a stem-and-leaf plot to display the data, which represent the numbers of hours 24 nurses work per week. Describe any patterns. 40 40 44 48 35 40 36 58 32 36 40 35 D 30 28 36 40 36 40 33 40 32 38 29 Determine the leaves in the stem-and-leaf plot below. Key: 3|3 = 33 Hours worked 2 4 What best describes the data? O A. Most nurses work under 40 hours per week. O B. Most nurses work over 40 hours per week. O C. Most nurses work between 40 and 50 hours per week, inclusive. O D. Most nurses work between 30 and 40 hours per week, inclusive. 40 3.arrow_forwardFind Q1, the median, Q3, and the IQR for the data shown below. (Exclude the median from the lower half and from the upper half of the data.) 14 17 18 23 24 48 55 56 68 76 88 Q1 Median= Q3 = IQR = %3Darrow_forwardhe data set below shows the ages of a random sample of children under the age of 14 who live in an apartment uilding. dake a dot plot to display the data. Children's Ages 7,4,7,7,2, 10, 12, 8, 7, 4arrow_forward
- Milaaanarrow_forwardhelp pleasearrow_forwardUse the stem-and-leaf plot to list the actual data entries. What is the maximum data entry? What is the minimum data entry? Key: 2 | 7=27 27 3 2 4 1224779 5 011233 3 4 4 4 4 56 689 6 999 7 399 8 5 Choose the correct actual data entries below. O A. 27, 32, 41, 42, 42, 44, 47, 47, 49, 50, 51, 51, 52, 53, 53, 53, 54, 54, 54, 54, 55, 56, 56, 58, 59, 69, 69, 69, 73, 79, 79, 85 B. 27, 32, 41, 42, 44, 47, 49, 50, 51, 52, 53, 54, 55, 56, 58, 59, 69, 73, 79, 85 OC. 2.7, 3.2, 4.1, 4.2, 4.4, 4.7, 4.9, 5.0, 5.1, 5.2, 5.3, 5.4, 5.5, 5.6, 5.8, 5.9,6.9, 7.3, 7.9, 8.5 O D. 2.7, 3.2, 4.1, 4.2, 4.2, 4.4, 4.7, 4.7, 4.9, 5.0, 5.1, 5.1, 5.2, 5.3, 5.3, 5.3, 5.4, 5.4, 5.4, 5.4, 5.5, 5.6, 5.6, 5.8, 5.9, 6.9, 6.9, 6.9, 7.3, 7.9, 7.9, 8.5 The maximum data entry is The minimum data entry isarrow_forward
- E Use a stem-and-leaf plot that has two rows for each stem to display the data, which represent the income (in millions) of 30 of the highest paid athletes. Describe any patterns. 76 45 34 35 36 44 50 35 56 56 44 43 81 53 38 73 68 46 63 38 87 34 34 42 45 58 Determine the leaves in the stem-and-leaf plot below. Key: 313-33 Income ($ millions) 3 What best describes the data? 站 F2 R OA. Most of the incomes are less than 60 million dollars. OB. Most of the incomes are between 50 and 70 million dollars. OC. The incomes are evenly spread between 30 and 90 million dollars. OD. Most of the incomes are greater than 60 million dollars. V % 5 F4 T G B Y H N F5 46 53 U J 37 41 F6 ( 8 M K 9 F8 L P Alt Gr DELL F9 N F10 TE F11 1 T F12 - Intro Power Impant Sleep Pet Sis Insert Blog Despl Wake ONLOFF Supr Inicioarrow_forwardScenario: A pediatrician wants to determine the relation that may exist between a child’s height and head circumference. She randomly selects eleven 3-year old children from her practice, measures their heights and head circumference, and obtains the data shown below: Child’s Height and Head Circumference Height (inches) Head Circumference (inches) 27.75 17.6 24.5 17.3 25.5 17.4 26 17.5 25 17.1 25.75 17.8 26.5 17.5 27 17.7 26.75 17.5 26.75 17.8 27.5 17.7 If the pediatrician wants to use height to predict head circumference, determine which variable is the explanatory variable and which is response variable. Draw a scatter diagram of the data. Draw the best fit line on the scatter diagram. Does this scatter diagram show a positive, negative, or no relationship between a child’s height and the head circumference?arrow_forwardHekp me fasttt also whisker and box plotarrow_forward
arrow_back_ios
arrow_forward_ios
Recommended textbooks for you
 A First Course in Probability (10th Edition)ProbabilityISBN:9780134753119Author:Sheldon RossPublisher:PEARSON

A First Course in Probability (10th Edition)
Probability
ISBN:9780134753119
Author:Sheldon Ross
Publisher:PEARSON
