MATLAB: An Introduction with Applications
6th Edition
ISBN: 9781119256830
Author: Amos Gilat
Publisher: John Wiley & Sons Inc
expand_more
expand_more
format_list_bulleted
Concept explainers
Question
thumb_up100%
I need help on the last 3

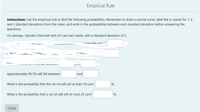
Transcribed Image Text:Empirical Rule
Instructions: Use the empirical rule to find the following probabilities. Remember to draw a normal curve, label the x-values for 1, 2,
and 3 standard deviations from the mean, and write in the probabilities between each standard deviation before answering the
questions.
On average, Upstate Chevrolet sells 20 cars each week, with a standard deviation of 2.
- above the me
n nel Ur:
y Cdis
Ann.
Approximately 99.7% will fall between
and
What is the probability that the car lot will sell at least 18 cars?
%
What is the probability that a car lot will sell at most 26 cars?
Check
Expert Solution
This question has been solved!
Explore an expertly crafted, step-by-step solution for a thorough understanding of key concepts.
This is a popular solution
Trending nowThis is a popular solution!
Step by stepSolved in 2 steps with 2 images

Knowledge Booster
Learn more about
Need a deep-dive on the concept behind this application? Look no further. Learn more about this topic, statistics and related others by exploring similar questions and additional content below.Similar questions
- It takes Doug 3 days to reroof a house. If Doug's son helps him, the job can be completed in 2 days. How long would it take Doug's son, working alone, to do the job?arrow_forwardFire departments in your county have an average benchmark of 6 minutes on a fire call from the time the 911 operator takes the call to the time the first firefighter arrives on the scene. This 6-minute average includes a 1-minute call handling time from when 911 gets the call to when they notify the fire department. There is a 1-minute time from when the firefighters are notified to when they get out of the fire station. Then they have 4 minutes from when they leave the station to when they arrive on scene. Two fire departments in your county are being compared. From one fire department, a random sample of 10 calls has a mean of 6.51 minutes total with a standard deviation of 0.26 minutes. From the other fire department, a random sample of 11 calls shows a mean of 6.42 minutes with a standard deviation of 0.19. Construct a 90% confidence interval for the difference in the mean call time between the two fire departments. Fire departments in your county have an average benchmark of 6…arrow_forwardFor every 2 weekend days, there are 5 school daysarrow_forward
arrow_back_ios
arrow_forward_ios
Recommended textbooks for you
 MATLAB: An Introduction with ApplicationsStatisticsISBN:9781119256830Author:Amos GilatPublisher:John Wiley & Sons Inc
 Probability and Statistics for Engineering and th...StatisticsISBN:9781305251809Author:Jay L. DevorePublisher:Cengage Learning
 Statistics for The Behavioral Sciences (MindTap C...StatisticsISBN:9781305504912Author:Frederick J Gravetter, Larry B. WallnauPublisher:Cengage Learning
 Elementary Statistics: Picturing the World (7th E...StatisticsISBN:9780134683416Author:Ron Larson, Betsy FarberPublisher:PEARSON
 The Basic Practice of StatisticsStatisticsISBN:9781319042578Author:David S. Moore, William I. Notz, Michael A. FlignerPublisher:W. H. Freeman
 Introduction to the Practice of StatisticsStatisticsISBN:9781319013387Author:David S. Moore, George P. McCabe, Bruce A. CraigPublisher:W. H. Freeman

MATLAB: An Introduction with Applications
Statistics
ISBN:9781119256830
Author:Amos Gilat
Publisher:John Wiley & Sons Inc

Probability and Statistics for Engineering and th...
Statistics
ISBN:9781305251809
Author:Jay L. Devore
Publisher:Cengage Learning

Statistics for The Behavioral Sciences (MindTap C...
Statistics
ISBN:9781305504912
Author:Frederick J Gravetter, Larry B. Wallnau
Publisher:Cengage Learning

Elementary Statistics: Picturing the World (7th E...
Statistics
ISBN:9780134683416
Author:Ron Larson, Betsy Farber
Publisher:PEARSON

The Basic Practice of Statistics
Statistics
ISBN:9781319042578
Author:David S. Moore, William I. Notz, Michael A. Fligner
Publisher:W. H. Freeman

Introduction to the Practice of Statistics
Statistics
ISBN:9781319013387
Author:David S. Moore, George P. McCabe, Bruce A. Craig
Publisher:W. H. Freeman