ENGR.ECONOMIC ANALYSIS
14th Edition
ISBN: 9780190931919
Author: NEWNAN
Publisher: Oxford University Press
expand_more
expand_more
format_list_bulleted
Question

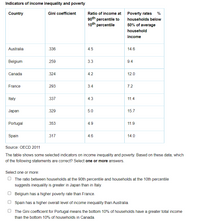
Transcribed Image Text:Indicators of income inequality and poverty
Country
Gini coefficient
Ratio of income at
Poverty rates
%
90th percentile to
10th percentile
households below
50% of average
household
income
Australia
336
4.5
14.6
Belgium
259
3.3
9.4
Canada
324
4.2
12.0
France
293
3.4
7.2
Italy
.337
4.3
11.4
Jаpan
329
5.0
15.7
Portugal
.353
4.9
11.9
Spain
317
4.6
14.0
Source: OECD 2011
The table shows some selected indicators on income inequality and poverty. Based on these data, which
of the following statements are correct? Select one or more answers.
Select one or more:
O The ratio between households at the 90th percentile and households at the 10th percentile
suggests inequality is greater in Japan than in Italy.
O Belgium has a higher poverty rate than France.
Spain has a higher overall level of income inequality than Australia.
O The Gini coefficient for Portugal means the bottom 10% of households have a greater total income
than the bottom 10% of households in Canada.
Expert Solution
This question has been solved!
Explore an expertly crafted, step-by-step solution for a thorough understanding of key concepts.
Step by stepSolved in 2 steps with 1 images

Knowledge Booster
Learn more about
Need a deep-dive on the concept behind this application? Look no further. Learn more about this topic, economics and related others by exploring similar questions and additional content below.Similar questions
- Ma1. Using diagrams, discuss the following aspects of income inequality. Draw two different Lorenz Curves, LCA & LCB, where the two curves cross. Discuss and compare the two in terms of the Top 1% Share.arrow_forwardPlease answer correct explain please asap Don't answer by pen paper plz.arrow_forwardCurrently, in the United States, poverty rates are comparatively low Group of answer choices for the elderly for the well-educated for whites and for all those in the other answers for the male-headed householdsarrow_forward
- 34arrow_forwardThe Lorenz curve for Bangladesh looks like this: Cumulative percentage of income 100 58.7 37.4 21.3 8.9 Bangladesh Lorenz Curve 20 60 80 Cumulative percentage of population 40 100 04 How much income do individuals in the second income quintile in Bangladesh receive?arrow_forward5arrow_forward
- Use the data from the table below to construct a Lorenz curve. Income Shares in the United States Lowest 20% Second Lowest 20% Third 20% Fourth 20% Highest 20% 5.2 10.3 15.3 22.4 46.9arrow_forward100 Cumulative Percentage of Income 80 8 8 8 L K Line of Perfect Income Equality Lorenz Curve 1 Lorenz Curve 2 20 40 60 80 100 Cumulative Percentage of Households Refer to Exhibit 28-2. This graph depicts the Lorenz curve for two countries, country 1 (Lorenz curve 1) and country 2 (Lorenz curve 2). Although the Gini coefficient is in country 1 than in country 2, the bottom quintile in receives a larger share of income compared to the bottom quintile in O a. lower, country 2; country 1 O b. lower, country 1; country 2 Oc. higher, country 2; country 1 O d. higher, country 1; country 2arrow_forwardA group of 10 golfing buddies have the following annual incomes: Income $32, 000 $12, 000 $56, 000 $120, 000 $10, 000 $38, 000 $70, 000 $16, 000 $20, 000 $24, 000 What is the total amount of income comprising the lowest quintile of this income distribution? Provide your answer below:arrow_forward
arrow_back_ios
arrow_forward_ios
Recommended textbooks for you

 Principles of Economics (12th Edition)EconomicsISBN:9780134078779Author:Karl E. Case, Ray C. Fair, Sharon E. OsterPublisher:PEARSON
 Engineering Economy (17th Edition)EconomicsISBN:9780134870069Author:William G. Sullivan, Elin M. Wicks, C. Patrick KoellingPublisher:PEARSON
 Principles of Economics (MindTap Course List)EconomicsISBN:9781305585126Author:N. Gregory MankiwPublisher:Cengage Learning
 Managerial Economics: A Problem Solving ApproachEconomicsISBN:9781337106665Author:Luke M. Froeb, Brian T. McCann, Michael R. Ward, Mike ShorPublisher:Cengage Learning
 Managerial Economics & Business Strategy (Mcgraw-...EconomicsISBN:9781259290619Author:Michael Baye, Jeff PrincePublisher:McGraw-Hill Education


Principles of Economics (12th Edition)
Economics
ISBN:9780134078779
Author:Karl E. Case, Ray C. Fair, Sharon E. Oster
Publisher:PEARSON

Engineering Economy (17th Edition)
Economics
ISBN:9780134870069
Author:William G. Sullivan, Elin M. Wicks, C. Patrick Koelling
Publisher:PEARSON

Principles of Economics (MindTap Course List)
Economics
ISBN:9781305585126
Author:N. Gregory Mankiw
Publisher:Cengage Learning

Managerial Economics: A Problem Solving Approach
Economics
ISBN:9781337106665
Author:Luke M. Froeb, Brian T. McCann, Michael R. Ward, Mike Shor
Publisher:Cengage Learning

Managerial Economics & Business Strategy (Mcgraw-...
Economics
ISBN:9781259290619
Author:Michael Baye, Jeff Prince
Publisher:McGraw-Hill Education