
MATLAB: An Introduction with Applications
6th Edition
ISBN: 9781119256830
Author: Amos Gilat
Publisher: John Wiley & Sons Inc
expand_more
expand_more
format_list_bulleted
Related questions
Question
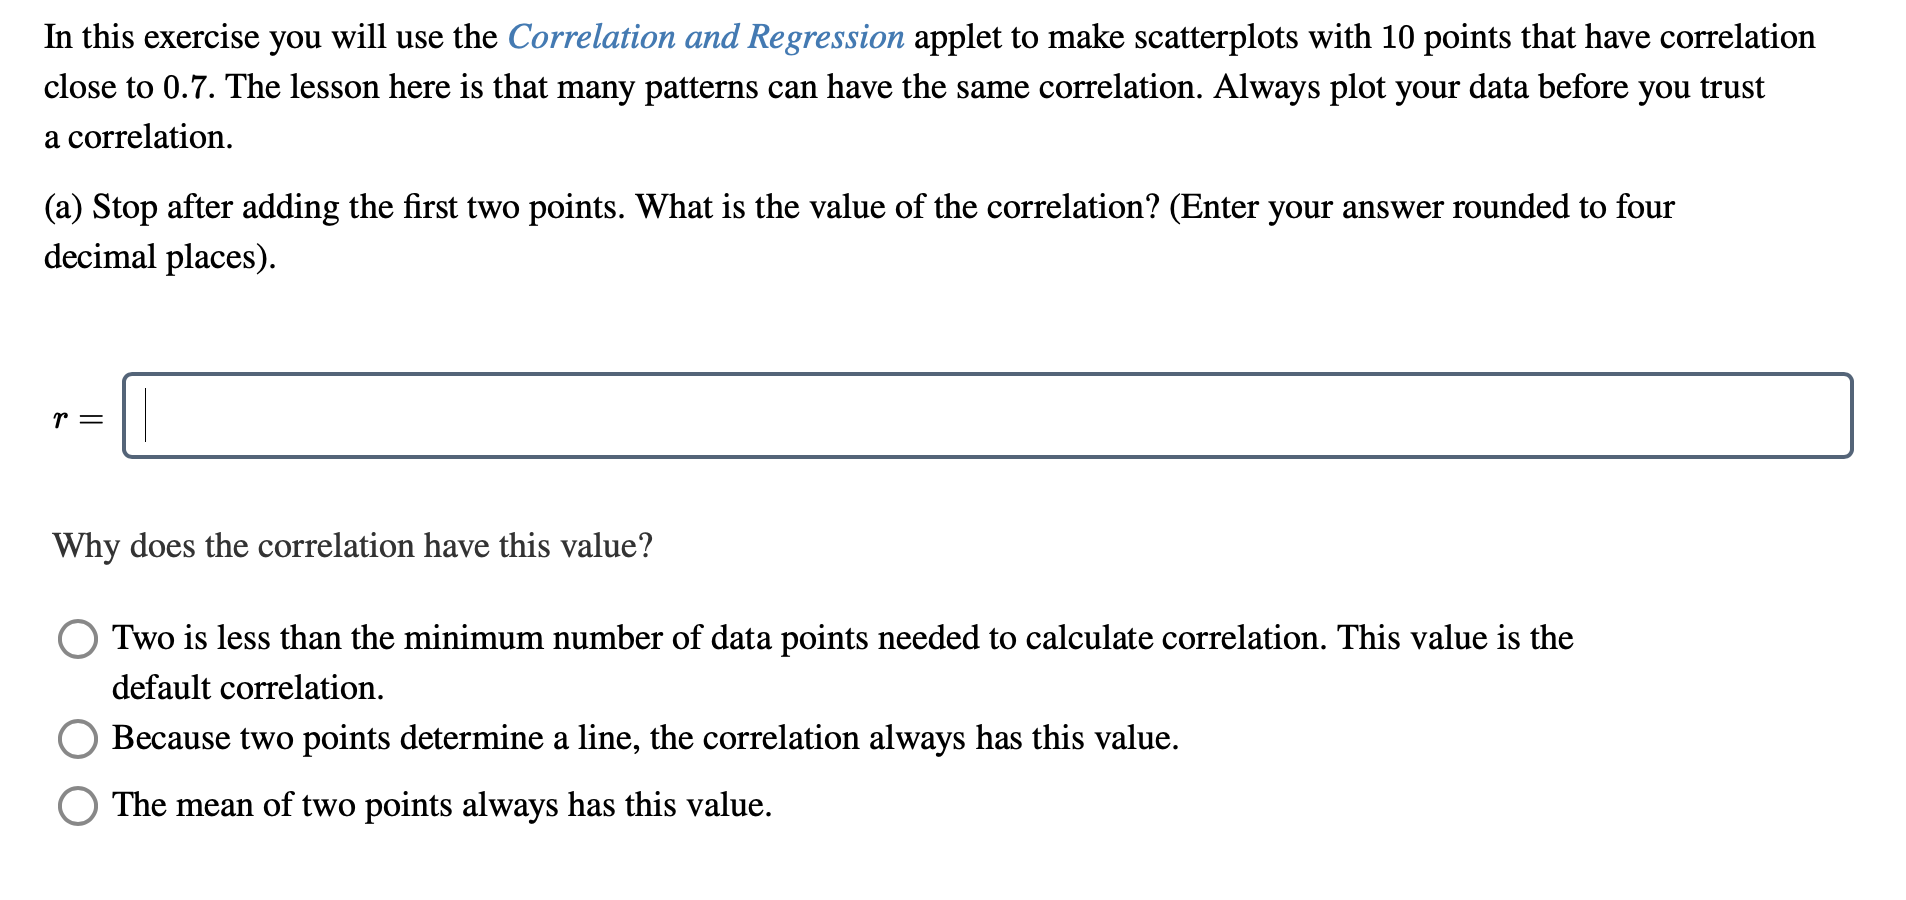

Transcribed Image Text:In this exercise you will use the Correlation and Regression applet to make scatterplots with 10 points that have correlation
close to 0.7. The lesson here is that many patterns can have the same correlation. Always plot your data before you trust
a correlation.
(a) Stop after adding the first two points. What is the value of the correlation? (Enter your answer rounded to four
decimal places).
Why does the correlation have this value?
Two is less than the minimum number of data points needed to calculate correlation. This value is the
default correlation.
Because two points determine a line, the correlation always has this value.
The mean of two points always has this value.
Expert Solution
This question has been solved!
Explore an expertly crafted, step-by-step solution for a thorough understanding of key concepts.

This is a popular solution

Trending nowThis is a popular solution!

Step by stepSolved in 2 steps

Knowledge Booster

Similar questions
- You generate a scatter plot using Excel. You then have Excel plot the trend line and report the equation and the r value. The regression equation is reported as y = – 17.55x + 59.45 and the r? = 0.0081. What is the correlation coefficient for this data set? r =arrow_forwardPlease explain simply. Thanks.arrow_forwardLet x be the average number of employees in a group health insurance plan, and let y be the average administrative cost as a percentage of claims. x 3 7 15 32 75 y 40 35 30 26 18 (a) Make a scatter diagram of the data and visualize the line you think best fits the data. Flash Player version 10 or higher is required for this question. You can get Flash Player free from Adobe's website. (b) Would you say the correlation is low, moderate, or strong? positive or negative? strong and negative moderate and negative strong and positive low and negative low and positive moderate and positive (c) Use a calculator to verify that Σx = 132, Σx2 = 6932, Σy = 149, Σy2 = 4725, and Σxy = 2997. Compute r. (Round your answer to three decimal places.)r = As x increases, does the value of r imply that y should tend to increase or decrease? Explain. Given our value of r, we cannot draw any conclusions for the behavior of y as x increases. Given our value of r, y should tend to…arrow_forward
- Solve all parts , second photo is the graph that was requested.arrow_forwardYou generate a scatter plot using Excel. You then have Excel plot the trend line and report the equation and the ² value. The regression equation is reported as y = 49.18x + 40.52 and the r² = 0.5041. What is the correlation coefficient for this data set? r =arrow_forwardPlease help with these questions.arrow_forward
- Use the following to answer the question: ˆy=−4x+10.3 with R2=35%. Which best describes the correlation? Weak negative linear relationship Weak positive linear relationship Moderate negative linear relationship No linear relationship Moderate positive linear relationshiparrow_forwardSolve this example in the picture below, read the question carefully and answer it correctly. Please solve the work accurately and make sure that you check your work, this deals with correlations.arrow_forwardUsing your favorite statistics software package, you generate a scatter plot with a regression equation and correlation coefficient. The regression equation is reported asy=43.25x+19.44y=43.25x+19.44and the r=0.98r=0.98.What proportion of the variation in y can be explained by the variation in the values of x?r² = %arrow_forward
arrow_back_ios
arrow_forward_ios
Recommended textbooks for you
- MATLAB: An Introduction with ApplicationsStatisticsISBN:9781119256830Author:Amos GilatPublisher:John Wiley & Sons Inc
 Probability and Statistics for Engineering and th...StatisticsISBN:9781305251809Author:Jay L. DevorePublisher:Cengage Learning
 Statistics for The Behavioral Sciences (MindTap C...StatisticsISBN:9781305504912Author:Frederick J Gravetter, Larry B. WallnauPublisher:Cengage Learning
  Elementary Statistics: Picturing the World (7th E...StatisticsISBN:9780134683416Author:Ron Larson, Betsy FarberPublisher:PEARSON
 The Basic Practice of StatisticsStatisticsISBN:9781319042578Author:David S. Moore, William I. Notz, Michael A. FlignerPublisher:W. H. Freeman
 Introduction to the Practice of StatisticsStatisticsISBN:9781319013387Author:David S. Moore, George P. McCabe, Bruce A. CraigPublisher:W. H. Freeman
MATLAB: An Introduction with Applications
Statistics
ISBN:9781119256830
Author:Amos Gilat
Publisher:John Wiley & Sons Inc
Probability and Statistics for Engineering and th...
Statistics
ISBN:9781305251809
Author:Jay L. Devore
Publisher:Cengage Learning
Statistics for The Behavioral Sciences (MindTap C...
Statistics
ISBN:9781305504912
Author:Frederick J Gravetter, Larry B. Wallnau
Publisher:Cengage Learning
Elementary Statistics: Picturing the World (7th E...
Statistics
ISBN:9780134683416
Author:Ron Larson, Betsy Farber
Publisher:PEARSON
The Basic Practice of Statistics
Statistics
ISBN:9781319042578
Author:David S. Moore, William I. Notz, Michael A. Fligner
Publisher:W. H. Freeman
Introduction to the Practice of Statistics
Statistics
ISBN:9781319013387
Author:David S. Moore, George P. McCabe, Bruce A. Craig
Publisher:W. H. Freeman