Structural Analysis
6th Edition
ISBN: 9781337630931
Author: KASSIMALI, Aslam.
Publisher: Cengage,
expand_more
expand_more
format_list_bulleted
Concept explainers
Question
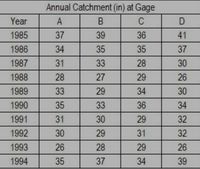
In the table below annual rainfalls of gage A, B, C and D are given. Gage D was permanently relocated after a period of 5 yr (at the end of 1989); thus adjust the recorded values from 1985 through 1989 of gage D using double mass curve assume the data for the other gages are consistent.

Transcribed Image Text:Annual Catchment (in) at Gage
Year
A
C
1985
37
39
36
41
1986
34
35
35
37
1987
31
33
28
30
1988
28
27
29
26
1989
33
29
34
30
1990
35
33
36
34
1991
31
30
29
32
1992
30
29
31
32
1993
26
28
29
26
1994
35
37
34
39
Expert Solution
This question has been solved!
Explore an expertly crafted, step-by-step solution for a thorough understanding of key concepts.
Step by stepSolved in 7 steps with 2 images

Knowledge Booster
Learn more about
Need a deep-dive on the concept behind this application? Look no further. Learn more about this topic, civil-engineering and related others by exploring similar questions and additional content below.Similar questions
- Question 2 3 pts Estimate the total excess/effective rainfall in mm for a 5% AEP storm. The temporal pattern distribution (in %) for a 45-min rainfall duration (5-min time step) for a South Australian catchment is given below. 13.18 9.3 9.3 13.18 20.93 13.95 13.18 20.93 13.95 4.65 8.53 6.98 Consider: Total rainfall depth = 26.2 mm IL = 7.8 mm and CL = 2.6 mm/hr Give your answer to two decimal places. Note: When presenting your answers, round your answer as instructed, but for your calculation, use as many decimal places as you have to avoid rounding errors.arrow_forwardConduct a single-station flood-frequency analysis on annual flood peaks of a small stream as given below has acoefficient of skewness equal to zero. Do all necessary steps for conducting such an analysis including the use of theWeibull plotting positions. Based on the single-station flood-frequency analysis plot, determine the return period of100 cfs flood peak. Also, obtain the flood peaks for return periods of 10-year and 5-year. Year 1984 1985 1986 1987 1988 1989 1990 1991 1992 1993Annual Flood Peak (cfs) 300 60 80 100 40 800 400 30 700 80arrow_forward6- Maximum annual rainfall depth data are fitted with a distribution that is positively skewed (i.e., it has a longer tail to the right). If the mean value for the distribution is 4.22 in, then the rainfall depth with return period 2 years will be (use the next page table): (5 p) (A) Strictly less than 4.22 in (B) Equal to 4.22 in (C) Strictly larger than 4.22 in (D) None of the abovearrow_forward
arrow_back_ios
arrow_forward_ios
Recommended textbooks for you

 Structural Analysis (10th Edition)Civil EngineeringISBN:9780134610672Author:Russell C. HibbelerPublisher:PEARSON
 Principles of Foundation Engineering (MindTap Cou...Civil EngineeringISBN:9781337705028Author:Braja M. Das, Nagaratnam SivakuganPublisher:Cengage Learning
 Fundamentals of Structural AnalysisCivil EngineeringISBN:9780073398006Author:Kenneth M. Leet Emeritus, Chia-Ming Uang, Joel LanningPublisher:McGraw-Hill Education
 Traffic and Highway EngineeringCivil EngineeringISBN:9781305156241Author:Garber, Nicholas J.Publisher:Cengage Learning


Structural Analysis (10th Edition)
Civil Engineering
ISBN:9780134610672
Author:Russell C. Hibbeler
Publisher:PEARSON

Principles of Foundation Engineering (MindTap Cou...
Civil Engineering
ISBN:9781337705028
Author:Braja M. Das, Nagaratnam Sivakugan
Publisher:Cengage Learning

Fundamentals of Structural Analysis
Civil Engineering
ISBN:9780073398006
Author:Kenneth M. Leet Emeritus, Chia-Ming Uang, Joel Lanning
Publisher:McGraw-Hill Education


Traffic and Highway Engineering
Civil Engineering
ISBN:9781305156241
Author:Garber, Nicholas J.
Publisher:Cengage Learning