Concept explainers
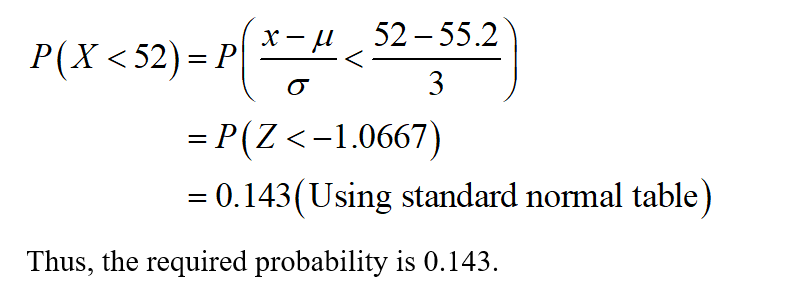
In the country of United States of Heightlandia, the height measurements of ten-year-old children are approximately
A) What is the
Answer= (Round your answer to 3 decimal places.)
B) What is the probability that a randomly chosen child has a height of more than 54.1 inches?
Answer= (Round your answer to 3 decimal places.)
From the provided information,
Mean (µ) = 55.2 inches
Standard deviation (σ) = 3 inches
Let X be a random variable which represents the height measurements of ten-year-old children.
X~N (55.2, 3)
A)
The required probability that a randomly chosen child has a height of less than 52 inches can be obtained as:

Step by stepSolved in 3 steps with 2 images

- A professor of statistics noticed that the marks in his course are normally distributed. He also noticed that his morning classes average 73% with a standard deviation of 12% on their final exams. His afternoon classes average 79% with a standard deviation of 11%. A. What is the probability that a randomly selected student in the morning class has a higher final exam mark than a randomly selected student from an afternoon class? Probability = B. What is the probability that the mean mark of four randomly selected students from a morning class is greater than the average mark of four randomly selected students from an afternoon class? Probability =arrow_forwardWhat type of distribution is this : you measure the GPA of every student in a high school to the nearest thousandth?arrow_forwardSuppose that the distance of fly balls hit to the outfield (in baseball) is normally distributed with a mean of 242 feet and a standard deviation of 46 feet.Use your graphing calculator to answer the following questions. Write your answers in percent form. Round your answers to the nearest tenth of a percent. a) If one fly ball is randomly chosen from this distribution, what is the probability that this ball traveled fewer than 204 feet? P(fewer than 204 feet) = ____% b) If one fly ball is randomly chosen from this distribution, what is the probability that this ball traveled more than 234 feet? P(more than 234 feet) = ______%arrow_forward
- Suppose that the distance of fly balls hit to the outfield (in baseball) is normally distributed with a mean of 254 feet and a standard deviation of 43 feet. Use your graphing calculator to answer the following questions. Write your answers in percent form. Round your answers to the nearest tenth of a percent. a) If one fly ball is randomly chosen from this distribution, what is the probability that this ball traveled fewer than 204 feet? P(fewer than 204 feet) = % b) If one fly ball is randomly chosen from this distribution, what is the probability that this ball traveled more than 216 feet? P(more than 216 feet) =arrow_forwardThe heights of women in the United States are normally distributed with a mean of 63.7 inches and a standard deviation of 2.7 inches. If you randomly select a woman in the United States, what is the probability that she will be between 65 and 67 inches tall?arrow_forwardJust do subpart "b"arrow_forward
- The NJ Department of Health has reported the average life span of NJ residents is 81 years. If the standard deviation is σ = 4 years, what is the probability of a person living to at least 92 years of age?arrow_forwardThe result of a nationwide aptitude test in mathematics are normally distributed sith mean=63 and standard deviation =5 a. What is the probability of scores greater than 65? b. What is the probability of scores less than 65?arrow_forward
 MATLAB: An Introduction with ApplicationsStatisticsISBN:9781119256830Author:Amos GilatPublisher:John Wiley & Sons Inc
 Probability and Statistics for Engineering and th...StatisticsISBN:9781305251809Author:Jay L. DevorePublisher:Cengage Learning
 Statistics for The Behavioral Sciences (MindTap C...StatisticsISBN:9781305504912Author:Frederick J Gravetter, Larry B. WallnauPublisher:Cengage Learning
 Elementary Statistics: Picturing the World (7th E...StatisticsISBN:9780134683416Author:Ron Larson, Betsy FarberPublisher:PEARSON
 The Basic Practice of StatisticsStatisticsISBN:9781319042578Author:David S. Moore, William I. Notz, Michael A. FlignerPublisher:W. H. Freeman
 Introduction to the Practice of StatisticsStatisticsISBN:9781319013387Author:David S. Moore, George P. McCabe, Bruce A. CraigPublisher:W. H. Freeman


