MATLAB: An Introduction with Applications
6th Edition
ISBN: 9781119256830
Author: Amos Gilat
Publisher: John Wiley & Sons Inc
expand_more
expand_more
format_list_bulleted
Question
Hi, Based on the attached:
1. Test the hypothesis that housing prices decrease at a decreasing rate as one moves farther away from the beach. Show all work.
2. Provide a graphical illustration of the implied relationship between log price and distance to the beach.

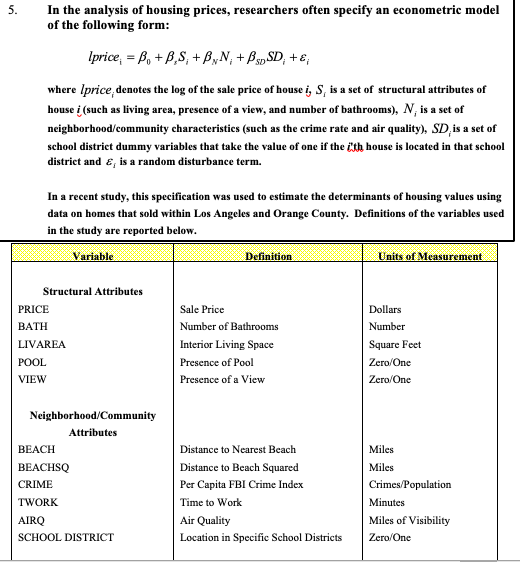
Transcribed Image Text:In the analysis of housing prices, researchers often specify an econometric model
of the following form:
5.
Iprice, = B, + B,S, + ByN; + BspSD, +€,
where Iprice, denotes the log of the sale price of house i, S, is a set of structural attributes of
house i (such as living area, presence of a view, and number of bathrooms), N, is a set of
neighborhood/community characteristics (such as the crime rate and air quality), SD,is a set of
school district dummy variables that take the value of one if the ith house is located in that school
distriet and €, is a random disturbance term.
In a recent study, this specification was used to estimate the determinants of housing values using
data on homes that sold within Los Angeles and Orange County. Definitions of the variables used
in the study are reported below.
Variable
Definition
Units of Measurement
Structural Attributes
PRICE
Sale Price
Dollars
BATH
Number of Bathrooms
Number
LIVAREA
Interior Living Space
Square Feet
POOL
Presence of Pool
Zero/One
VIEW
Presence of a View
Zero/One
Neighborhood/Community
Attributes
BEACH
Distance to Nearest Beach
Miles
BEACHSQ
Distance to Beach Squared
Miles
CRIME
Per Capita FBI Crime Index
Crimes/Population
TWORK
Time to Work
Minutes
AIRQ
Air Quality
Miles of Visibility
SCHOOL DISTRICT
Location in Specific School Districts
Zero/One

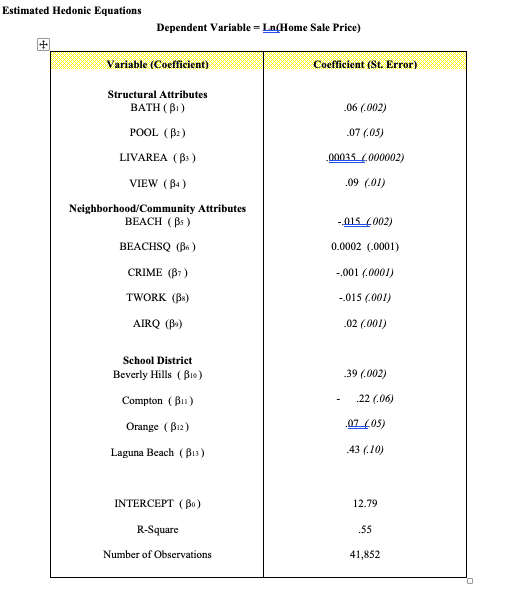
Transcribed Image Text:Estimated Hedonic Equations
Dependent Variable = Ln(Home Sale Price)
Variable (Coefficient)
Coefficient (St. Error)
Structural Attributes
BATH ( BI)
.06 (.002)
POOL (B2)
.07 (.05)
LIVAREA (B)
00035 (000002)
VIEW (B4)
.09 (.01)
Neighborhood/Community Attributes
BEACH (Bs)
-015 4002)
BEACHSQ (B6 )
0.0002 (.0001)
CRIME (B7)
-.001 (.0001)
TWORK (B)
-.015 (.001)
AIRQ (B»)
.02 (.001)
School District
Beverly Hills (Bi0)
39 (.002)
Compton ( B1)
22 (.06)
Orange (B12)
.07 (05)
Laguna Beach ( B13)
.43 (.10)
INTERCEPT ( Bo)
12.79
R-Square
.55
Number of Observations
41,852
Expert Solution
This question has been solved!
Explore an expertly crafted, step-by-step solution for a thorough understanding of key concepts.
This is a popular solution
Trending nowThis is a popular solution!
Step by stepSolved in 3 steps with 2 images

Knowledge Booster
Learn more about
Need a deep-dive on the concept behind this application? Look no further. Learn more about this topic, statistics and related others by exploring similar questions and additional content below.Similar questions
- Match the line with its slopearrow_forwardplease show step by steparrow_forwardThe graph plots the gas mileage of various cars from the same model year versus the weight of these cars in thousands of pounds. Describe the association between the two variables. Also explain what the point at the very top represents. 3.75 Weight (thousands of pounds) BIUA A LE xx, E 12pt Paragraph Submarrow_forward
- The linearization of a function works best when it is used to approximate a function, meaning behaviour and value, close to the point of tangency. A. True B. Falsearrow_forwardStudent Loans Data for selected years from 2011and projected to 2023 can be used to show that thebalance of federal direct student loans y, in billions ofdollars, is related to the number of years after 2010,x, by the function y = 130.7x + 699.7.a. Graph the function for x-values corresponding2010 to 2025.b. Find the value of y when x is 13.c. What does this function predict the balance offederal direct student loans will be in 2029?(Source: U.S. Office of Management and Budget)arrow_forwardLet f(x) be the height of a maple tree in inches and the number of years since 2000. A linear model for the data is f(x) = 9.44x + 84.182. 220 210- 200 190 180 170 160 150- 140- 130- 120 110 100 -90- ge 70- -60 -50+ 3 Ő 9 12 A) To the nearest inch, estimate the height of the maple tree in 2013. inches B) Use the equation to find the year in which the tree will be 250 inches tall.arrow_forward
arrow_back_ios
arrow_forward_ios
Recommended textbooks for you
 MATLAB: An Introduction with ApplicationsStatisticsISBN:9781119256830Author:Amos GilatPublisher:John Wiley & Sons Inc
 Probability and Statistics for Engineering and th...StatisticsISBN:9781305251809Author:Jay L. DevorePublisher:Cengage Learning
 Statistics for The Behavioral Sciences (MindTap C...StatisticsISBN:9781305504912Author:Frederick J Gravetter, Larry B. WallnauPublisher:Cengage Learning
 Elementary Statistics: Picturing the World (7th E...StatisticsISBN:9780134683416Author:Ron Larson, Betsy FarberPublisher:PEARSON
 The Basic Practice of StatisticsStatisticsISBN:9781319042578Author:David S. Moore, William I. Notz, Michael A. FlignerPublisher:W. H. Freeman
 Introduction to the Practice of StatisticsStatisticsISBN:9781319013387Author:David S. Moore, George P. McCabe, Bruce A. CraigPublisher:W. H. Freeman

MATLAB: An Introduction with Applications
Statistics
ISBN:9781119256830
Author:Amos Gilat
Publisher:John Wiley & Sons Inc

Probability and Statistics for Engineering and th...
Statistics
ISBN:9781305251809
Author:Jay L. Devore
Publisher:Cengage Learning

Statistics for The Behavioral Sciences (MindTap C...
Statistics
ISBN:9781305504912
Author:Frederick J Gravetter, Larry B. Wallnau
Publisher:Cengage Learning

Elementary Statistics: Picturing the World (7th E...
Statistics
ISBN:9780134683416
Author:Ron Larson, Betsy Farber
Publisher:PEARSON

The Basic Practice of Statistics
Statistics
ISBN:9781319042578
Author:David S. Moore, William I. Notz, Michael A. Fligner
Publisher:W. H. Freeman

Introduction to the Practice of Statistics
Statistics
ISBN:9781319013387
Author:David S. Moore, George P. McCabe, Bruce A. Craig
Publisher:W. H. Freeman