
ENGR.ECONOMIC ANALYSIS
14th Edition
ISBN: 9780190931919
Author: NEWNAN
Publisher: Oxford University Press
expand_more
expand_more
format_list_bulleted
Related questions
Question
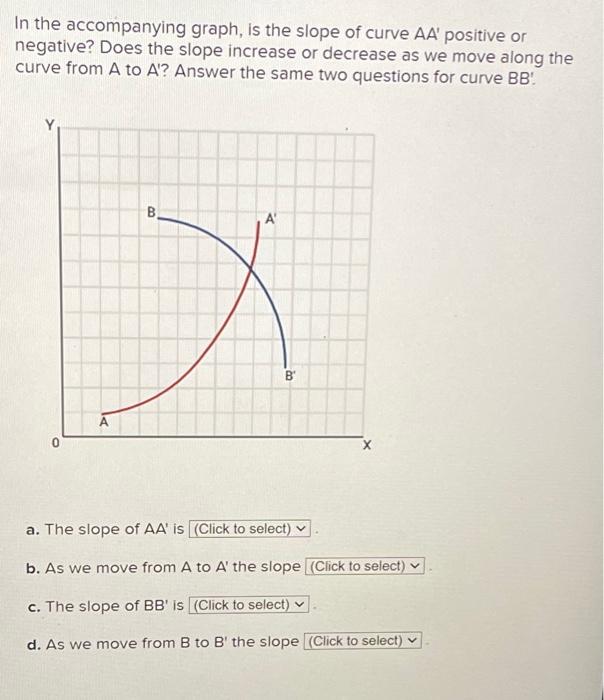

Transcribed Image Text:In the accompanying graph, is the slope of curve AA' positive or
negative? Does the slope increase or decrease as we move along the
curve from A to A'? Answer the same two questions for curve BB'
B
A'
B
a. The slope of AA' is (Click to select)
b. As we move from A to A' the slope [(Click to select)
c. The slope of BB' is (Click to select)
d. As we move from B to B' the slope (Click to select)
Expert Solution
This question has been solved!
Explore an expertly crafted, step-by-step solution for a thorough understanding of key concepts.

Step by stepSolved in 3 steps

Knowledge Booster


Learn more about
Need a deep-dive on the concept behind this application? Look no further. Learn more about this topic, economics and related others by exploring similar questions and additional content below.Similar questions
- 7arrow_forwardIn the accompanying graph, is the slope of curve A A' positive or negative? Does the slope increase or decrease as we move along the curve from A to A'? Answer the same two questions for curve BB'.arrow_forwardWhy isn't the answer b? How is the figure on the right fixed when it fluctuates?arrow_forward
- Mark Gershon, owner of a musical instrument distributorship, thinks that demand for guitars may be related to the number of television appearances by the popular group Maroon 5 during the previous month. Gershon has collected the data shown in the following table: Maroon 5 TV Appearances Demand for Guitars This exercise contains only part a. a) Graph these data using the point drawing tool. The plotted graph shows a pattern that can be described by: A. Seasonality C. Random variations 3 5 8 7 7 79 3 5 6 6 10 7 B. Trend O D. Cycles 12- 11- 10- 9- 8- 7- 6- 5- 4- 3- 2- 1- 0- Guitar Demand 4 TV Appearances -00 10 11arrow_forwardCan you do a IS and LM both shifting to the left a grapharrow_forwarda) direct relationship. b) inverse relationship. c) converse relationship d) negative relationship.arrow_forward
- Find an equation in point-slope y -y, = m(x-x,) for the line through the given points. (- 3, – 3) and (2,7) What is the equation of the line in point-slope form? (Use integers or simplified fractions for any numbers in the equation.)arrow_forwardIn economics, what does the term ceteris paribus mean when analyzing the relationship between two variables? A. All other things being equal or held constant B. The direct relationship between two variables C. The inverse relationship between two variables D. The absence of any relationship between two variablesarrow_forwardFor each of the following scenarios, indicate whether the relationship between the two variables is positive or negative, as well as which line on the previous graph has a slope that reflects this type of relationship. Hint: The X-axis and Y-axis on the graph are not labeled intentionally. You need to substitute the variables from each scenario for the horizontal and vertical axis. For example, in the first scenario, X-axis should be labeled “ ice-cream" and Y-axis should be labeled "The temperature". Relationship options: positive, negative Line options: A, B, C, D True or False: Line D has a slope of infinity.arrow_forward
- Graph and label as either direct or indirect the relationships you would expect to find between (a) the number of inches of rainfal per month and the sale of umbrellas, (b) the amount of tuition and the level of enrollment at a university, and (c) the popularity of an entertainer and the price of her concert tickets.arrow_forwardUse a software of your own choice to calculate the daily log prices (lp) and daily log returns (Ir) i. Examine the descriptive statistics of both lp and Ir. What do you conclude about the distributions of lp and Ir? Is lp normally distributed? Is Ir normally distributed? Obtain the correlograms, and examine the autocorrelations and partial autocorrelations for both lp and Ir. What do you conclude about the behaviour of lp and Ir? Are they stationary/non-stationary? ii. iii. Are your conclusions about stationary/non-stationary of lp and lr confirmed by appropriate unit root tests?arrow_forwardGiven the following data table: X Y 21 68 72 55 38 59 57 57 45 61 What is the correlation between X and Y? Include 3 decimal places in your answer.arrow_forward
arrow_back_ios
SEE MORE QUESTIONS
arrow_forward_ios
Recommended textbooks for you
 Principles of Economics (12th Edition)EconomicsISBN:9780134078779Author:Karl E. Case, Ray C. Fair, Sharon E. OsterPublisher:PEARSON
 Engineering Economy (17th Edition)EconomicsISBN:9780134870069Author:William G. Sullivan, Elin M. Wicks, C. Patrick KoellingPublisher:PEARSON
 Principles of Economics (MindTap Course List)EconomicsISBN:9781305585126Author:N. Gregory MankiwPublisher:Cengage Learning
 Managerial Economics: A Problem Solving ApproachEconomicsISBN:9781337106665Author:Luke M. Froeb, Brian T. McCann, Michael R. Ward, Mike ShorPublisher:Cengage Learning
 Managerial Economics & Business Strategy (Mcgraw-...EconomicsISBN:9781259290619Author:Michael Baye, Jeff PrincePublisher:McGraw-Hill Education
Principles of Economics (12th Edition)
Economics
ISBN:9780134078779
Author:Karl E. Case, Ray C. Fair, Sharon E. Oster
Publisher:PEARSON
Engineering Economy (17th Edition)
Economics
ISBN:9780134870069
Author:William G. Sullivan, Elin M. Wicks, C. Patrick Koelling
Publisher:PEARSON
Principles of Economics (MindTap Course List)
Economics
ISBN:9781305585126
Author:N. Gregory Mankiw
Publisher:Cengage Learning
Managerial Economics: A Problem Solving Approach
Economics
ISBN:9781337106665
Author:Luke M. Froeb, Brian T. McCann, Michael R. Ward, Mike Shor
Publisher:Cengage Learning
Managerial Economics & Business Strategy (Mcgraw-...
Economics
ISBN:9781259290619
Author:Michael Baye, Jeff Prince
Publisher:McGraw-Hill Education